Hello readers! After the ups and downs of crypto assets in May 2022, have you taken profit from the market rebound yet? Let’s find out more as a reference in determining which crypto assets you can buy or sell!
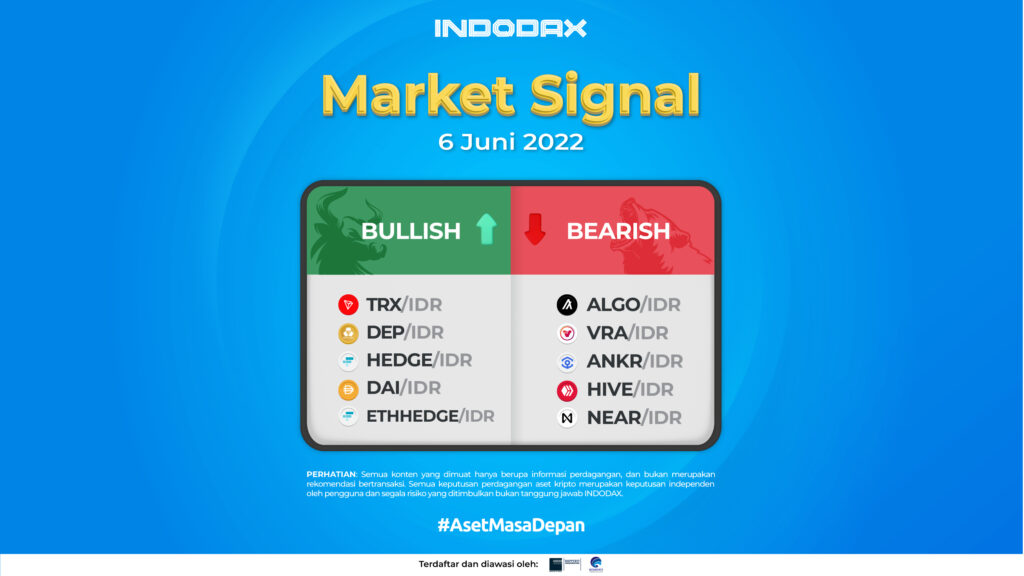
5 Bullish Crypto Assets
-
Tron (TRX)
The EMA/200 line at 1.048 indicates a fairly strong support, if the candle is able to form beyond that line, the Uptrend will be on the consolidation side.

There is a support line at the 1.030 price level if the trend weakens, but if this support is broken, there is a fairly strong support level at the 990, on the contrary the resistance is at the 1.290 price range.
-
DEAPcoin (DEP)
DEP experienced a significant increase to form a full body candle on May 23, 2022. Based on a 4-hour time frame, this was a turning point for DEAPcoin (DEP) to change the direction of the trend from bearish into a bullish trend as market rebound.

The bullish trend will continue if DEAPcoin (DEP) is able to stay at least above the EMA/200 which is currently at 249 and does not break the strong support at 240.
-
1x Short Bitcoin Token (HEDGE)
The use of a 1-day chart indicates that if the rising trend starts on 04 May 2022, the candle is able to stay above the EMA/200 and does not break the support level at 1,212,670, so that the trend immediately experiences a fairly high increase.

The rising trend will test the price at 1,649,390. This is a resistance level formed due to a significant price increase on May 12, 2022. The weakening will test the price at 1,400,000.
The MACD indicator shows that the trend is in the negative zone, but this will be considered normal if it remains above the 1,300,000 level.
-
Multi-collateral DAI (DAI)
In the 1-Day time frame, Multi-collateral DAI (DAI) is confirmed to be in Bullish phase when the EMA/5, EMA/75 and EMA/85 break out the EMA/200. This bullish trend will continue if the price is able to rise above the next resistance line at the 14,700 price level.

Seeing the trend using the Bollinger Bands indicator, the lines are mostly narrowing so the price will be in limited movement, the RSI indicator illustrates that the price still needs further confirmation before it verifies a market rebound.
-
1X Short Ethereum Token (ETHHEDGE)
The MACD indicator shows the possibility of a negative trend if there is a correction and the trend weakens, but the trend will be on the positive path if it remains above the 274.130 price level.

The Bullish phase occurred on May 21, 2022, the price remained at the support level of 270,000 so that the trend direction remained on the positive side. It had touched the overbought zone so that the price experienced a regular correction, because it did not exceed the 275,000 price.
A new trend will be formed if it can break out and stay above the resistance level of 317.570, which will make the price move away from the EMA/75 line at 261.862.
5 Bearish Crypto Assets
-
Algorand (ALGO)
Looking at the trend using a 1-day time frame, it can be seen that the bearish phase in Algorand (ALGO) has occurred since January 27, which began with a break of 21,500 price followed by a breakout of the support level of 18,230.

The bearish trend will improve if it is able to penetrate the resistance level of 7,230. If this level is penetrated and is able to break the 8,000 price, it will open opportunities for strengthening further. However, if it weakens followed by a break of support level at 5,000, the bearish zone will go deeper.
-
Verasity (VRA)
The 1-day trend movement indicates that it is currently in a sideways phase or limited movement between the 80 – 150 price range. The MACD indicator shows a positive indication for a market rebound, a new trend will be formed if it can break out and stay above a strong resistance level at the price of 200.

The fall in Verasity (VRA) price started on January 26, 2022, when it was unable to penetrate the 495 level to make the price reverse direction and weaken further. However, it was stuck at the support level of 270 but on April 26 2022 this level was broken making Verasity (VRA) touched the lowest price since listing on Indodax.
-
Ankr (ANKR)
It had crossed the EMA/200 line at the price of 1.240, but it did not last long because the price was unable to break the strong support level at the price of 1.470, thus making Ankr (ANKR) continue to weaken until it hit quite strong support level at the price of 860 and affected the price of ANKR which touched the price level of 375 on 12 May 2022, the lowest price since listing on Indodax.

The current trend movement is more limited or sideways bearish at the price range of 465 – 680. The RSI indicator shows that it is strengthening after previously being in the oversold phase.
-
HIVE (HIVE)
Before confirming to be in the Bearish Zone, HIVE weakened and penetrated the EMA/200 at the price of 15,000, then strengthened and penetrated the EMA/200, but it did not last long because it was unable to break the price of 17.850 and then hit the support level of 11.260.

The trend improvement or market rebound will occur if HIVE (HIVE) is able to penetrate and also stay above the resistance level of 8.960. If this price is hit, it will test the price level above it which is in the range of 10,700 – 11,260.
-
NEAR Protocol (NEAR)
The NEAR Protocol (NEAR), unable to break the resistance level at 191.170 and continued to weaken, until it broke below 139.200, causing a deep correction.

However, the MACD indicator confirms that they are in a positive phase, because the price level has experienced a deep correction. The direction of the current trend is narrowing, and it takes time to confirm the next trend.
There is a resistance level at the price of 139,000 if it strengthens, but it requires a fairly high increase if it wants to break out from that price level. Before touching that level, it must first be able to break through the 106,100 price level and stay above it.
So what do you think, Indodax friends? Have you taken profit from the market rebound in early June? Let us know on Indodax social media!
NOTE: If the 5 EMA crosses the WMA 75, 85 and 200 EMA lines and the lines intersect from the bottom up, then the market trend tends to go up (bullish), each table above shows that if the 5 EMA value is higher than the 75.85 WMA and 200 EMA, the market tends to go up (bullish).
If the RSI and MACD values ??show the same condition, it means that the market is showing the same trend. Overbought or oversold conditions are an indicator that the market is already at the point of changing direction of a trend.
ATTENTION: All contents which includes text, analysis, predictions, images in the form of graphics and charts, as well as news published on this website, is only used as trading information, and is not a recommendation or suggestion to take action in transacting either buying or selling. certain crypto assets. All crypto asset trading decisions are independent decisions by the users. Therefore, all risks arising from it, both profit and loss, are not the responsibility of Indodax.


