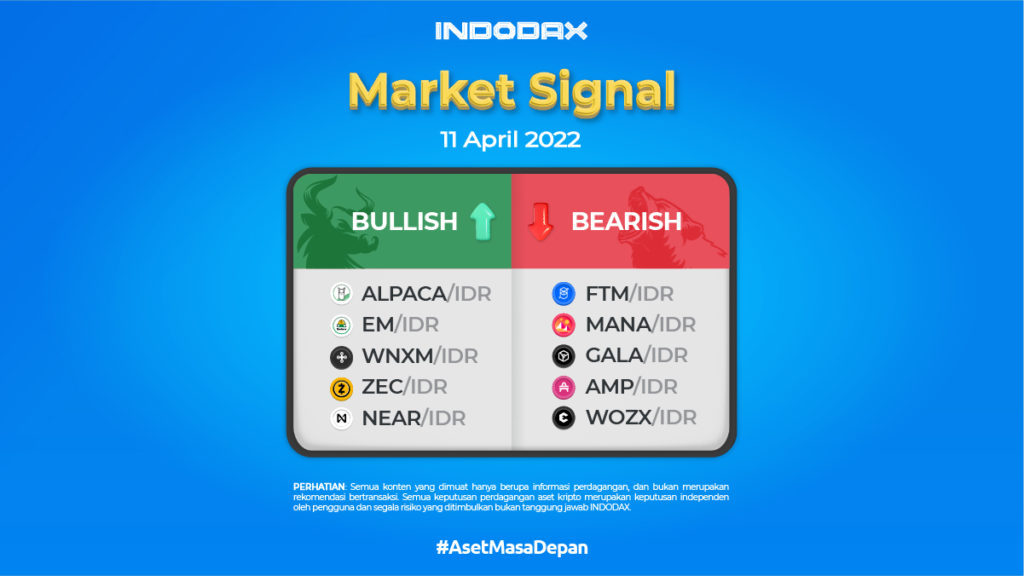
Hello Indodax friends! Here are 5 bullish and bearish crypto assets that can be used as a reference in determining which crypto assets you can buy or sell. First, Alpaca finance (ALPACA). Let’s check them out!
5 Bullish Crypto Assets
-
Alpaca Finance (ALPACA)
Alpaca Finance is the largest lending protocol on the Binance Smart Chain (BEP 20) that helps lenders get safe and stable returns, and offers unsecured loans to borrowers for leveraged yield farming positions.
In the DeFi ecosystem, Alpaca strengthens the liquidity layer of the integrated exchange, increasing their capital efficiency by connecting borrowers and lenders, through this enabling function, they have become a fundamental building block in DeFi, helping to bring financial power to every user.
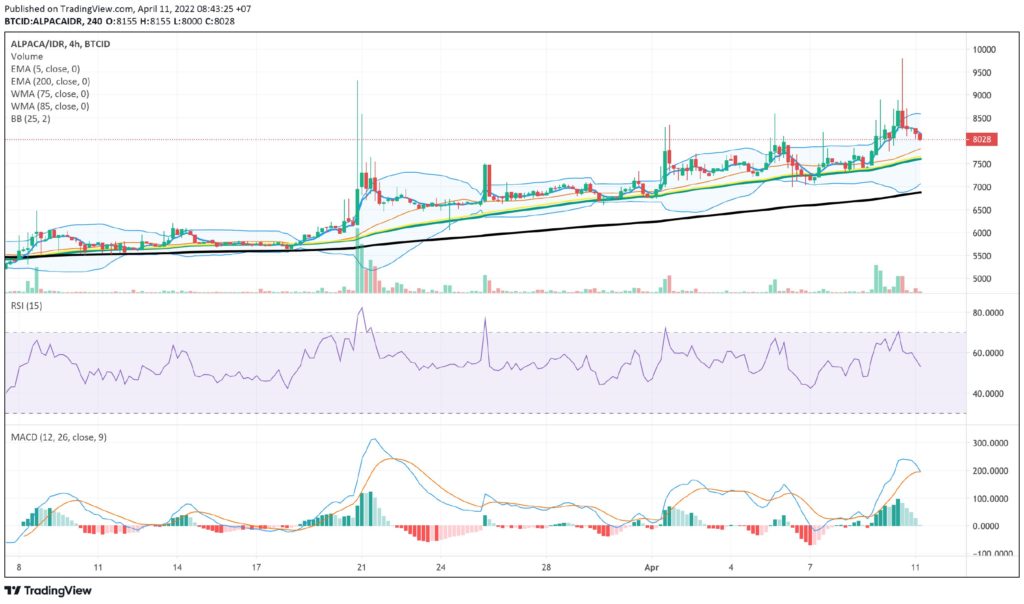
a trend with a narrow price range or sideways which is in the price range of 5520 – 6170, has been broken on March 20, 2022 which makes Alpaca Finance (ALPACA) enter a new trend, a bullish trend.
There has been a rise in price with a thin axis on the price chart, which touched the 9800 price range. With the MACD indicator indicating that the chart is positive, it indicates that the trend is quite strong in ALPACA/IDR.
-
Eminer (EM)
After Alpaca finance (ALPACA), based on the official website, Eminer is a company that combines cloud mining services (hash rate services) and crypto asset-based investment services (financial services).
EM Crypto Assets can be used as a transaction medium for cloud mining services available in the Eminer application. In addition, EM will later be used in investment activities, which include savings and loan mechanisms.
For example, User borrows EM from others and earns interest in return. And conversely, EM from the other party can be used for other needs.
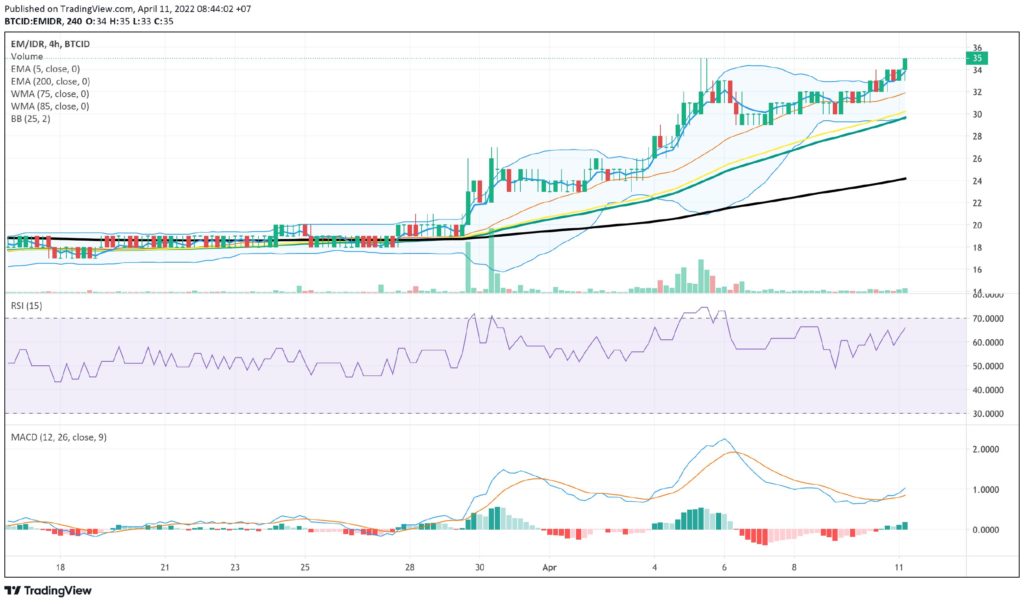
Based on the Eminer chart (EM) using a 4-hour time frame, it can be seen that there has been a sideways trend between 03 February 2022 and 30 March 2022. Then there is a break of resistance line at 22, so that it can form a bullish trend.
For the next increase in EM/IDR prices, it will test the 35 – 48 price range level, which will determine the direction of the next price movement.
-
Wrapped NXM (WNXM)
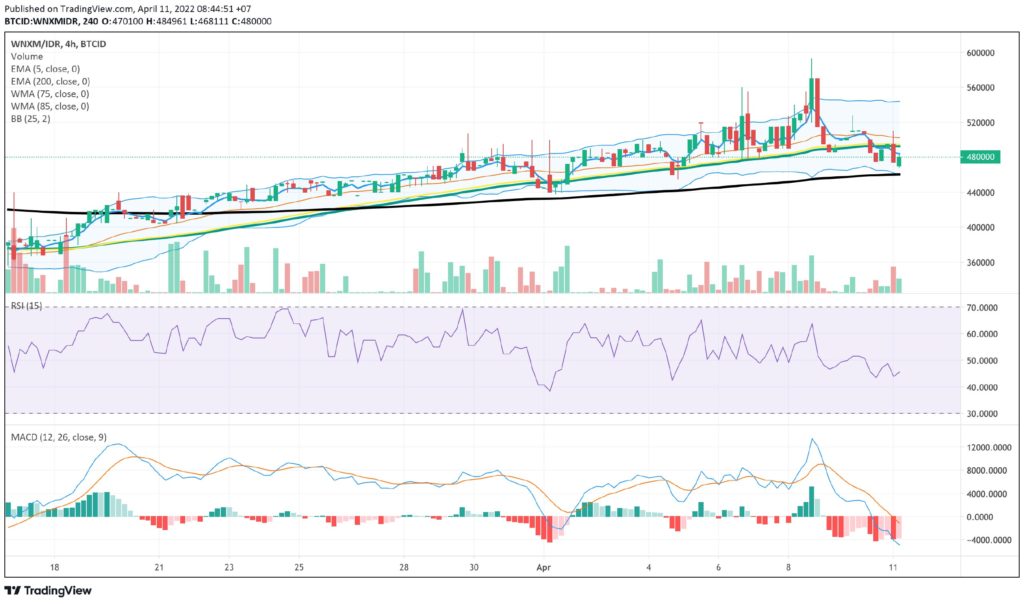
If Wrapped NXM (WNXM) continues to show price weakening, WNXM has a support level at around 439 thousand, if this support is also broken it will test the next price level at 420 thousand. However, if on the other hand WNXM/IDR experiences a strengthening, this strengthening will test a fairly strong resistance level in the range of 594 thousand to 643 thousand price levels.
-
Zcash (ZEC)
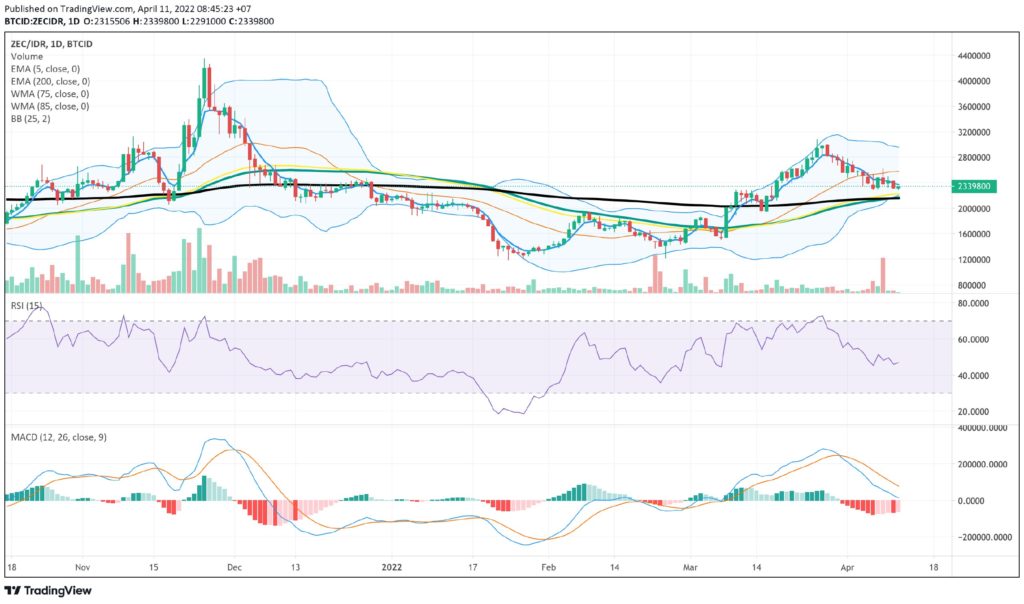
When using the 1D time frame, it can be seen that the EMA 5 indicator was able to cut though the EMA 200 and above, which was followed by WMA 75 and WMA 85 which occurred on April 02. If the price decreases, there is a support line in the price range of 1.92 million – 1.96 million. ZEC/IDR has reached its highest price since December 04, 2021, where it hit the price range of 3 million on March 26, 2022.
-
NEAR Protocol (NEAR)
NEAR Protocol (NEAR) has touched the highest price of 2.830,000 the highest since January 17, 2022. If NEAR/IDR continues to show strengthening, it will test in the price range of 2,870,000 – 2,930,000.
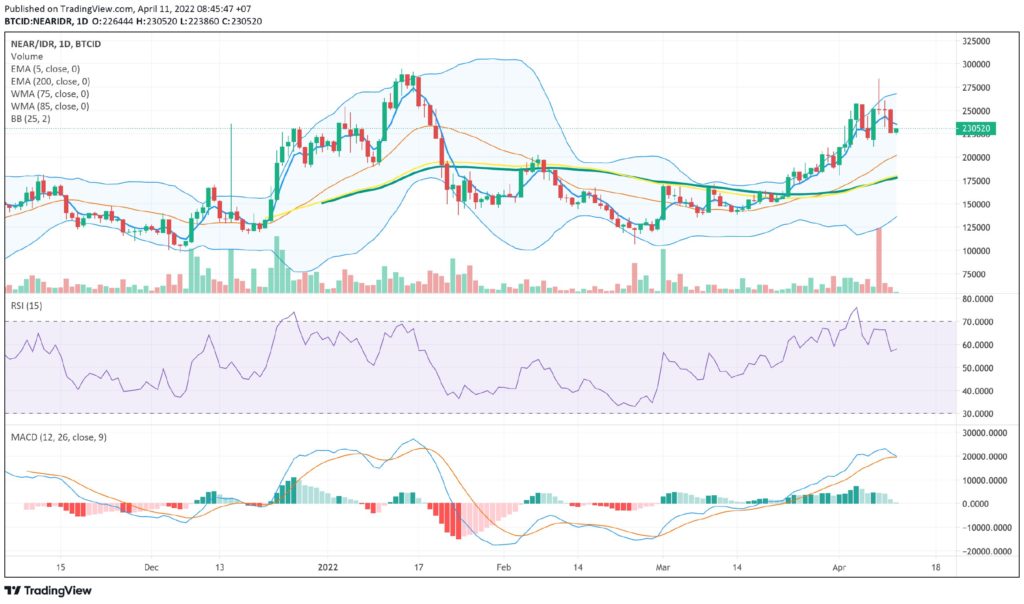
It had touched the overbought level on the RSI indicator, and had a positive chart trend movement using the MACD indicator.
5 Bearish Crypto Assets
-
Fantom (FTM)
Fantom (FTM) has experienced a downtrend since April 6, 2022 which is marked by the appearance of a candle with a body. This phase can be seen with the 4H time frame. If there is another decline, it will test the price of 17,440 to 17,220, the lowest price level on March 21, 2022.
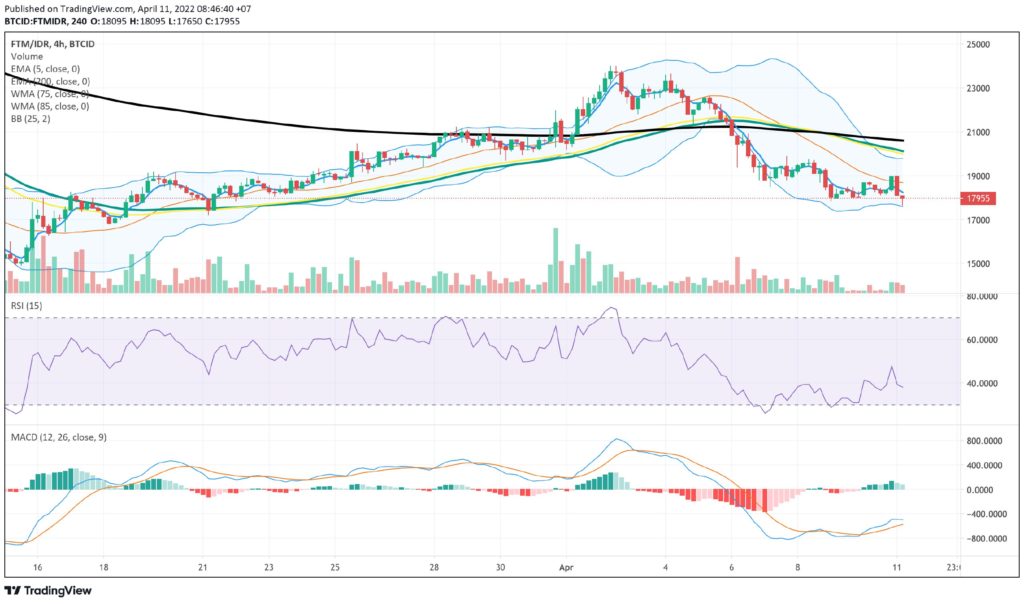
When combined with other indicators such as the MACD indicator, it indicates that the price is in a positive phase.
-
Decentraland (MANA)
When we look back at the price movement chart for Decentraland (MANA), Decentraland (MANA) has entered a downtrend phase since April 6th and is still in the same phase. If the price continues to decline, it will test the strong support level in the price range of 32,200 – 32,000.
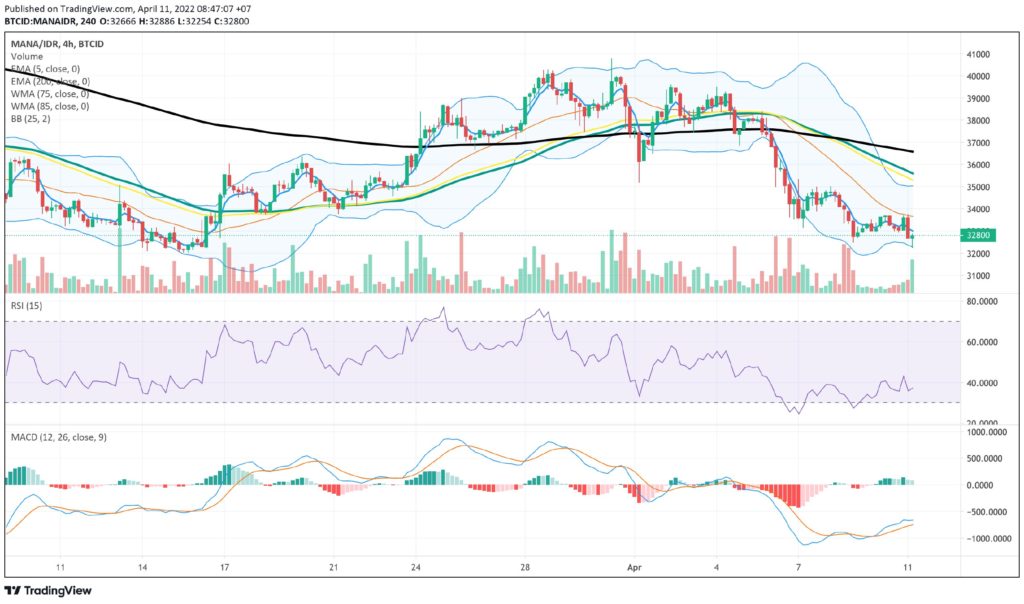
However, when combined with other indicators such as MACD, it will show a positive direction considering that MANA/IDR has experienced a fairly deep price decline.
-
Gala (GALA)
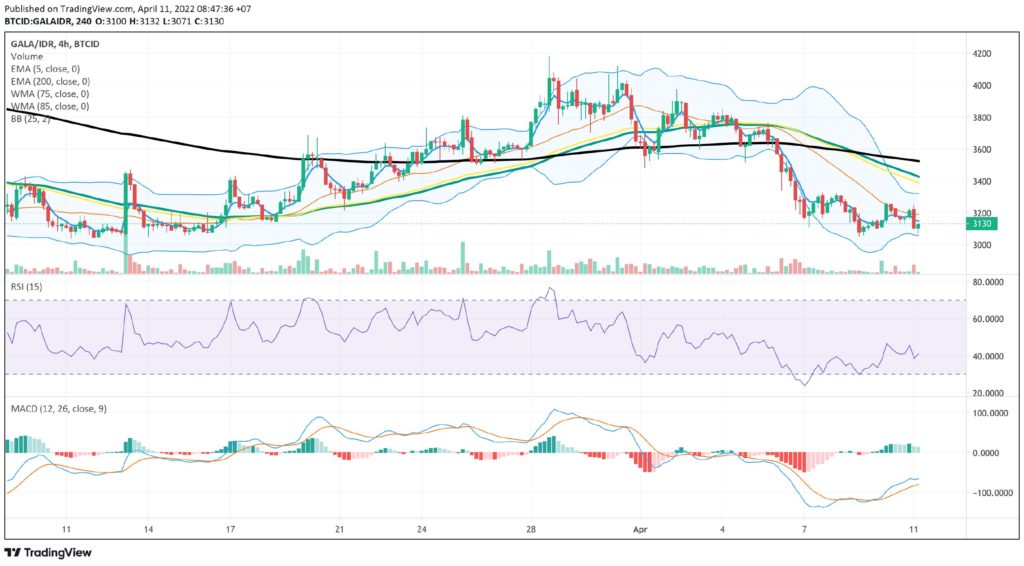
If we look at the RSI indicator, the Gala price decline (GALA) has been in the Oversold or overbought level, but now it has moved from that level where the positive trend is also supported by another indicator, namely MACD. The strengthening of the GALA/IDR price will test the 3,400 price if it breaks then it will test the 3,570 price level.
-
Amp (AMP)
If the Amp (AMP) price chart is viewed with a 4H time frame, there is a Downtrend Candlestick (Full Body Candlestick) movement which is strong enough to cause the AMP/IDR to enter a bearish phase where it will test the price range of 340 to 310.
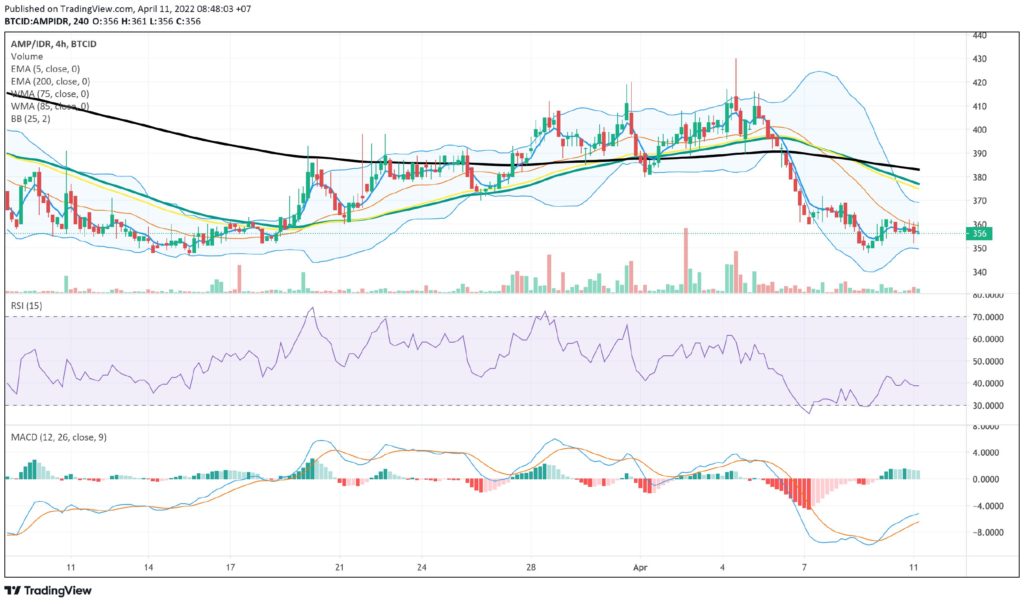
There is a sign that will lead to a positive trend if you look at the MACD indicator.
-
Efforce (WOZX)
With the 4H time frame, it can be seen that the price movement of Efforce (WOZX) still has to wait to confirm the next movement, it will increase or decrease to the nearest price level because the MACD indicator is showing signs of sideways.
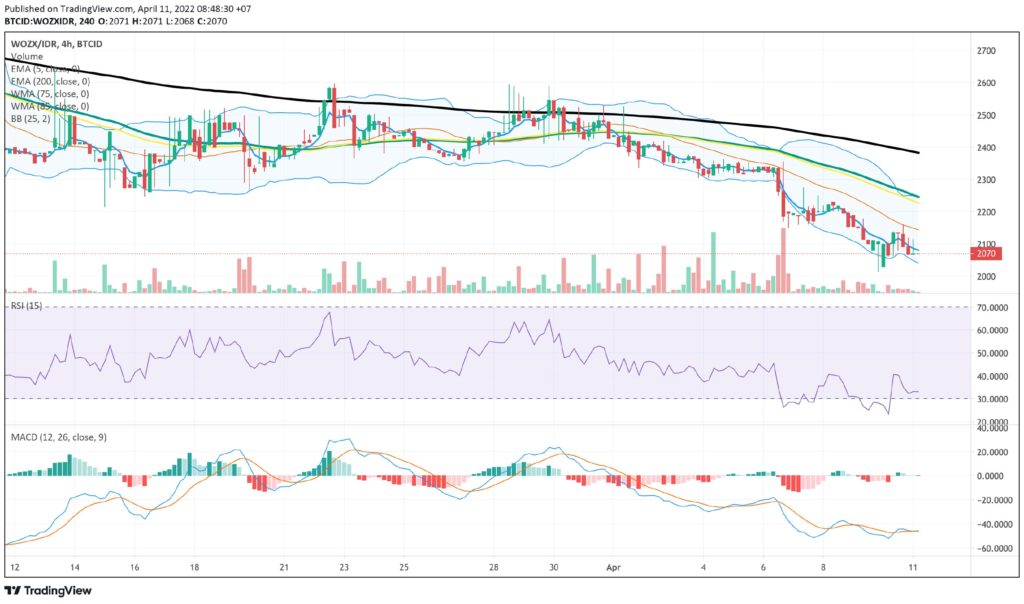
If WOZY/IDR strengthens, it will test the price level of 2,230 – 2,270.
NOTE: If the 5 EMA crosses the WMA 75, 85 and 200 EMA lines and the lines intersect from the bottom up, then the market trend tends to go up (bullish), each table above shows that if the 5 EMA value is higher than the 75.85 WMA and 200 EMA, the market tends to go up (bullish).
If the RSI and MACD values ??show the same condition, it means that the market is showing the same trend, overbought (overbought) or oversold (oversold) conditions are an indicator that the market is already at the point of changing direction of a trend.
ATTENTION: All contents which include text, analysis, predictions, images in the form of graphics and charts, as well as news published on this website, is only used as trading information, and are not a recommendation or suggestion to take action in transacting either buying or selling. certain crypto assets. All crypto asset-trading decisions are independent decisions by the users. Therefore, all risks stemming from it, both profit and loss, are not the responsibility of Indodax.


