A week prior to Idul Fitri holidays, will it affect the price of crypto assets? One of them is Origin Protocol, a newcomer in the bullish crypto assets lineup.
Let’s find out more as a reference in determining which crypto assets you can buy or sell!
5 Bullish Crypto Assets
-
Origin Protocol (OGN)
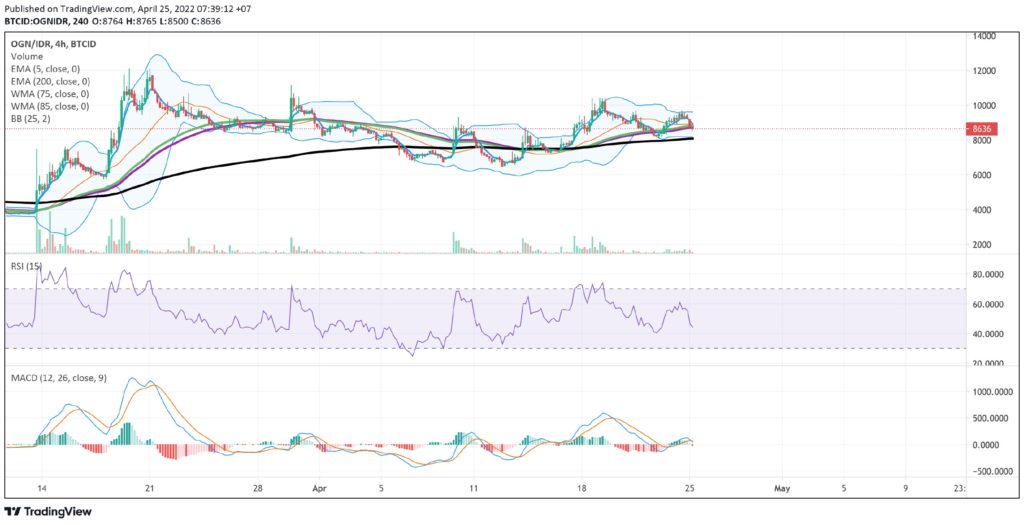
The movement that has shown a positive and upward trend occurred evidenced from the MACD indicator, where the line has crossed upwards. With the use of the 4 Hours time frame, the Origin Protocol (OGN) candle chart had weakened to a price range of 8,100 – 8,500 but the price reversed direction and continued to increase. Origin Protocol has WMA 75 and WMA 85 show quite supportive indications for price increases.

-
Lyfe Gold (LGOLD)
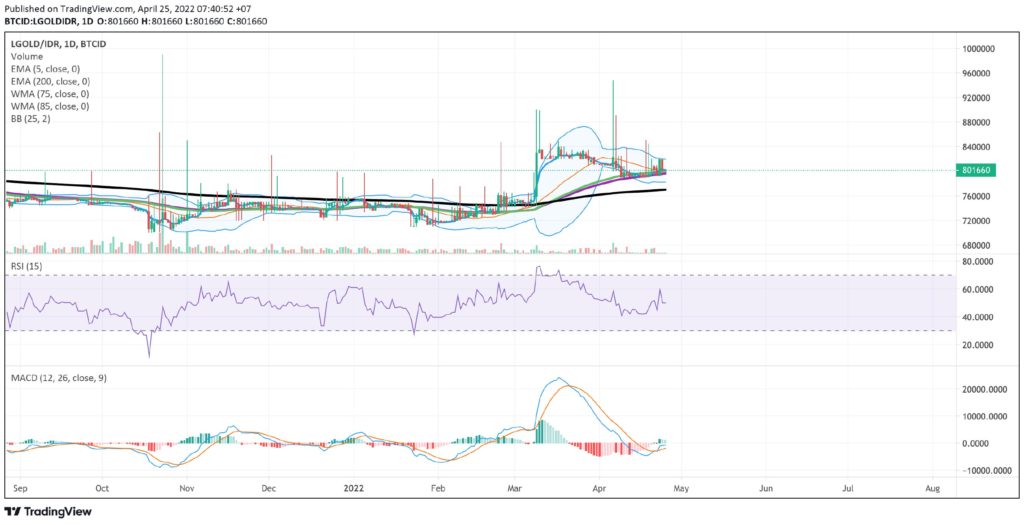
Other than Origin Protocol, Using a 1-Day chart, it can be shown that Lyfe Gold (LGOLD) is in a sideways phase where the candle is in the price range of 701,500 – 759,400. During the sideways phase, there was a strong candle that was able to penetrate that price range, the breakout phase occurred on March 9, 2022, causing LGOLD/IDR to enter a new phase, the bullish phase.

-
Alpaca Finance (ALPACA)
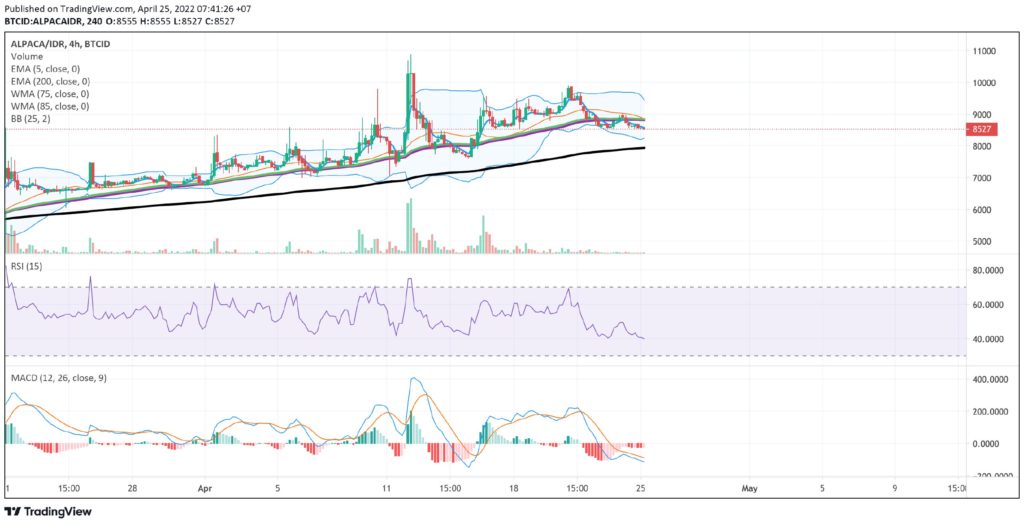
The increase in the ALPACA/IDR price has occurred for quite a while, where this increase occurred between March 20, 2022 and March 21, 2022 after the price chart was able to break the resistance line in the price range of 6,120 – 6,170.

-
PancakeSwap (CAKE)
PancakeSwap (CAKE) is a decentralized finance (DeFi) application that allows users to exchange tokens, provide liquidity through farming, and earn fees in return. PancakeSwap (CAKE) was launched in September 2020 and is a decentralized exchange for exchanging BEP20 tokens on the Binance Smart Chain.
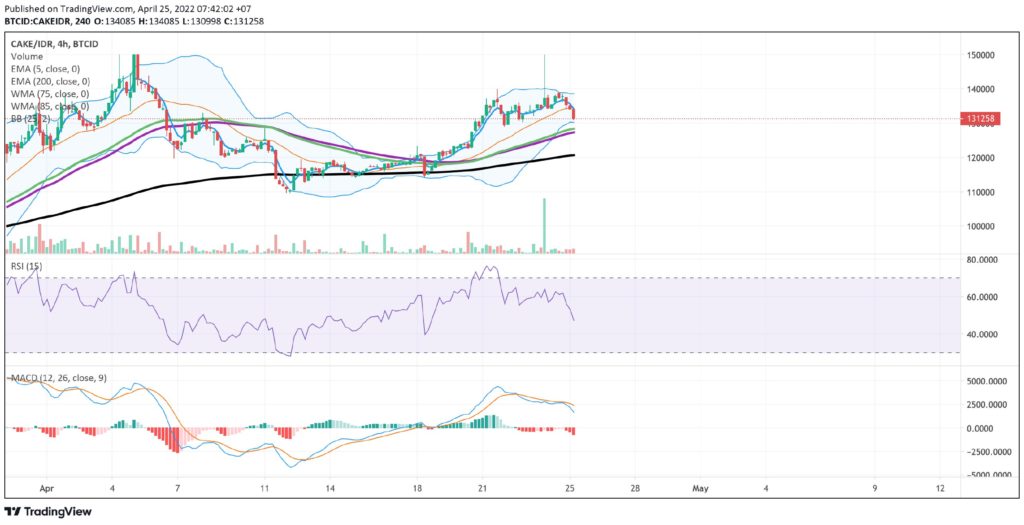

It had touched the support line twice, the first occurred on April 12, 2022 where it touched the price level of 109,700 and the second occurred on April 18, 2022 where it touched the price level of 114,200, but reversed direction instead which caused it to be able to break the resistance line at the price level of 127,700. The breakout of resistance line makes PancakeSwap (CAKE) enter the Bullish phase.
However we must wait further to see whether CAKE/IDR will continue to increase or decrease, because the MACD indicator is showing sideways signs.
-
Digix Gold Token (DGX)
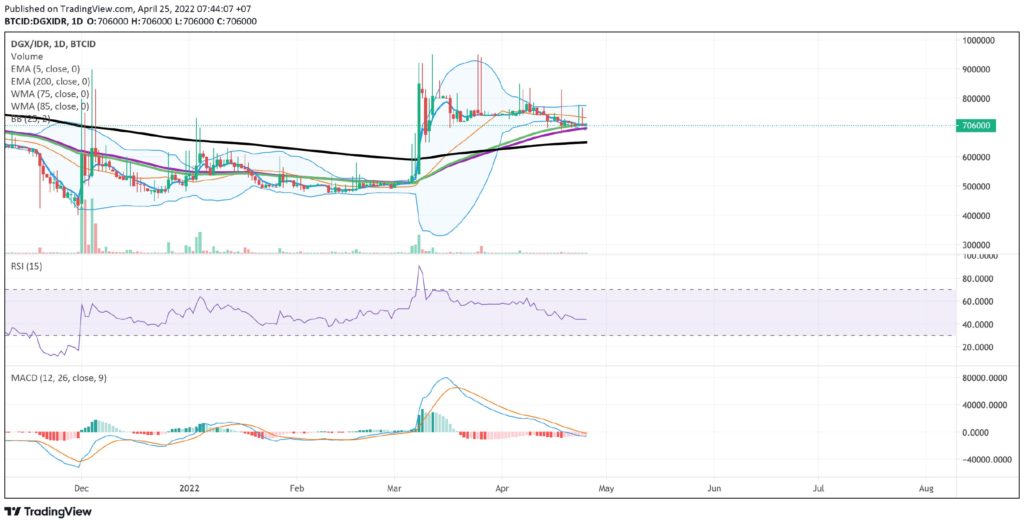
The 1-Day time frame shows that on March 08, 2022, there was a strong candle increase that made Digix Gold Token (DGX) in a bullish phase.

5 Bearish Crypto Assets
-
Gala (GALA)
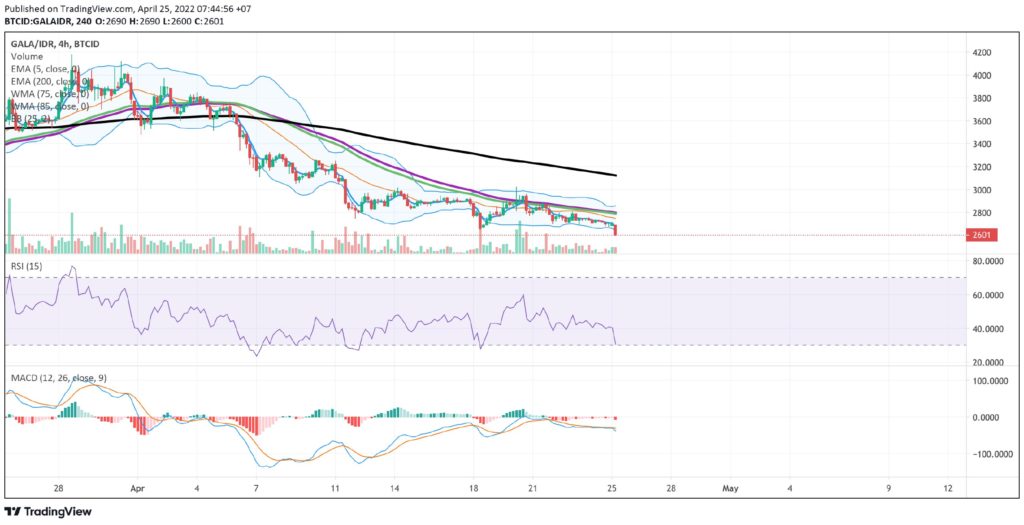
Gala (GALA) has entered a bearish phase since 07 April 2022 – 09 April 2022. Using the MACD indicator, it shows that there is a narrowing that will require further confirmation for the next direction trend.

-
Kardiachain (KAI)
Looking back, there has been a high price increase on March 29, 2022 that made Kardiachain (KAI) touch its highest price since January 22, 2022, where it touched the 790 price range. After touching that price then the Kardiachain (KAI) moves very volatile in a negative direction so that the Kardiachain (KAI) is in a Bearish phase.
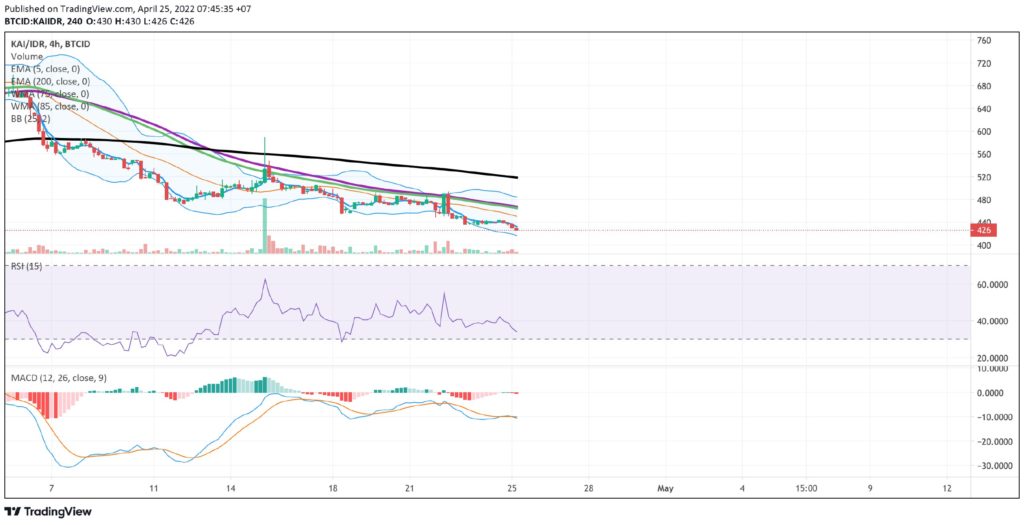

Because it has experienced a fairly deep correction, KAI/IDR has the possibility to strengthen.
-
LinkEye (LET)
LinkEye is a consortium-blockchain solution based on Hyperledger Fabric to facilitate global credit alliances. The Linkeye project has enormous scientific and technological significance to promote the development of a global credit-based society.
The bearish phase of LinkEye (LET) has occurred since May 24, 2021. The movement of LinkEye (LET) currently shows that it is experiencing a narrowing between the price ranges of 27 and 35.
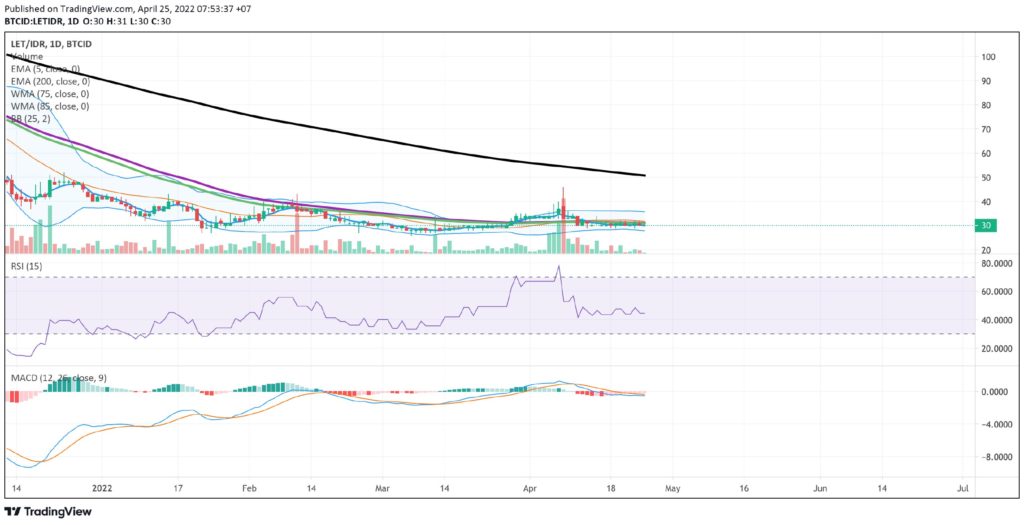

For the movement of the LET/IDR, it takes time for confirmation, to ensure whether the price in that range can be penetrated or not, if it can be penetrated then it can provide an indication of the shape of the next candle.
-
Global Social Chain (GSC)
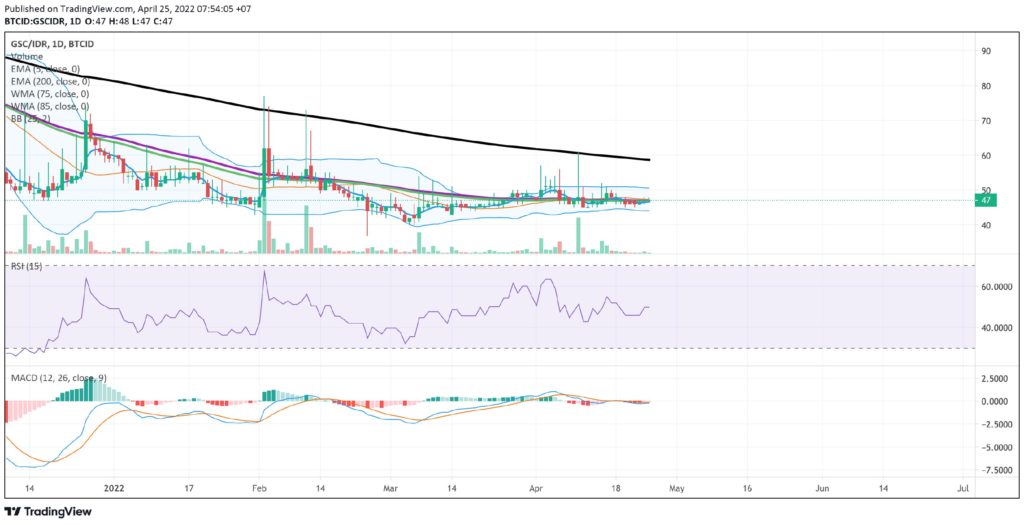
The downtrend phase in the Global Social Chain (GSC) has been ongoing for quite a while, if you use the 1-Day time frame, it can be seen that this phase started on September 30, 2022 – October 04, 2022, which was initiated by the weakening of EMA 5 followed by WMA 75, WMA 85 so it cut below the 200 EMA.

-
Btrips (BTR)
Btrips (BTR) touched ATH (All Time High) on April 1, 2022, where it hit the price range of 3,360 – 3,375. After touching ATH, the chart actually shows a negative movement or experiences a deep correction when compared to the ATH price.
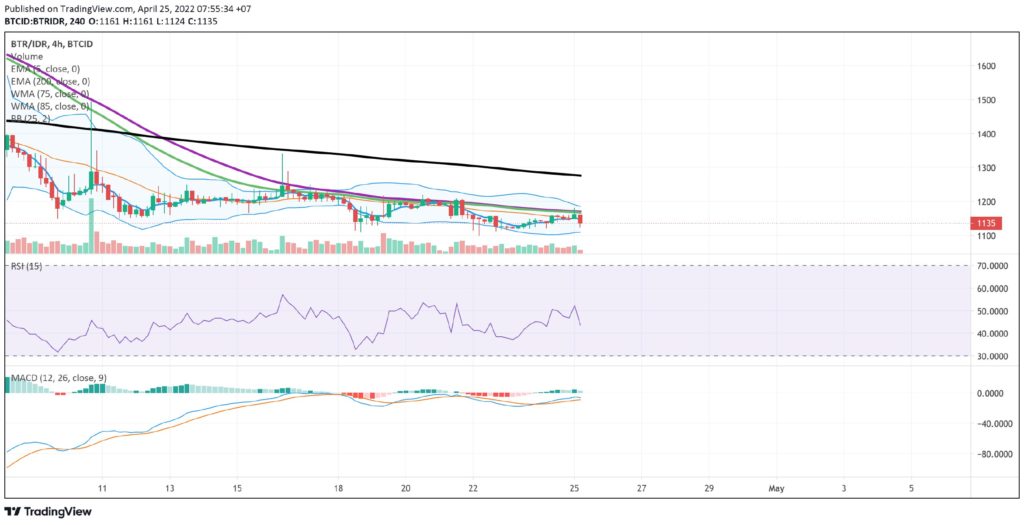

If it experiences a correction, it will test the 1.060 – 1,000 price level, if it experiences the opposite, or strengthening, it will move towards the 1,450 – 1,500 price level.
NOTE: If the 5 EMA crosses the WMA 75, 85 and 200 EMA lines and the lines intersect from the bottom up, then the market trend tends to go up (bullish), each table above shows that if the 5 EMA value is higher than the 75.85 WMA and 200 EMA, the market tends to go up (bullish).
If the RSI and MACD values ??show the same condition, it means that the market is showing the same trend. Overbought or oversold conditions are an indicator that the market is already at the point of changing direction of a trend.
ATTENTION: All contents which includes text, analysis, predictions, images in the form of graphics and charts, as well as news published on this website, is only used as trading information, and is not a recommendation or suggestion to take action in transacting either buying or selling. certain crypto assets. All crypto asset trading decisions are independent decisions by the users. Therefore, all risks arising from it, both profit and loss, are not the responsibility of Indodax.


