Hi friends of Indodax, it’s the end of the month! After the ups and downs of BTC that hit 200 million in price, BTC is now reaching 300 million in price! However, there are still some Altcoins that may be unfamiliar but can help your portfolio go green. Let’s find out more!
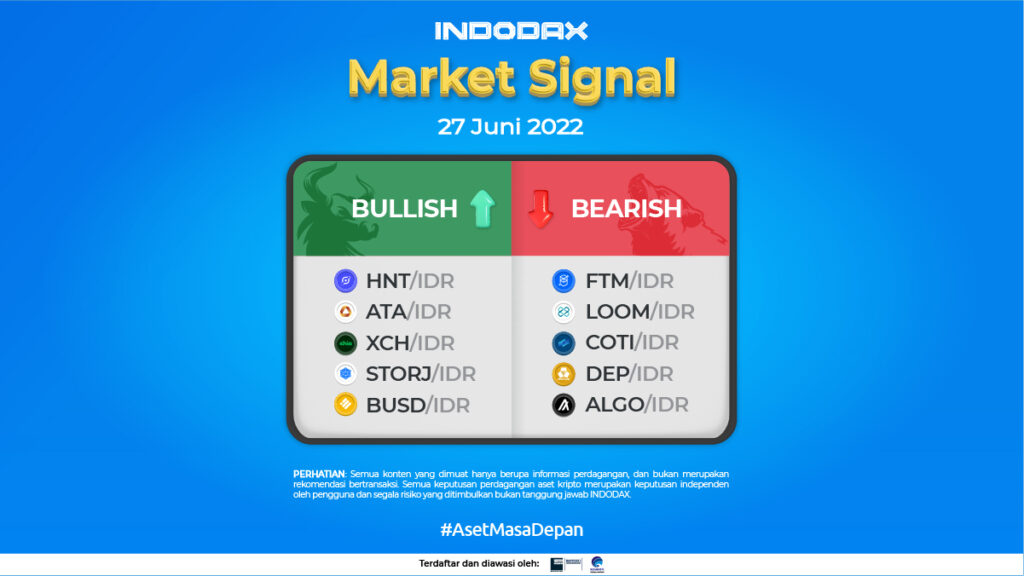
5 Bullish Crypto Assets
-
Helium (HNT)
After the price touched the 100,210 HNT level, it strengthened significantly after passing several resistance levels at 137,800, before hitting the 149,200 price level which made Helium moved through the EMA/200 line, indicating that buying pressure is high enough in line with the RSI indicator which showed that it was already in the overbought area. Afterward, the price failed to rise and experienced a correction but did not reach the strong support level at 100.210.

The trend will remain in a strengthening phase if it is able to stay above the EMA/200 line at 152,991. A strengthening will test the resistance at 179,000 level. If this price is broken, it will increase the chances of going in a new direction.
The RSI and MACD indicators showed that they were in a sideways phase so they need further price movement to confirm the support and resistance levels.
-
Automata Network (ATA)
The increase in the price of Automata Network (ATA) has occurred since June 8, 2022. The price previously moved sideways at the price level of 2,050 – 2,740 until the ATA penetrated the 2,730 price. A break of this level made the price trend move very volatile. It even touched the 4,235 price level, the highest price since May 2022.

Further strengthening will test the resistance level at 3.370 and further at the price of 3.985. On the other hand, a weakening will lead to test the 2,730 level, which if penetrated, will lead to a strong support level at around 2.050.
-
Chia Network (XCH)
The XCH was in the bullish trend which occurred on June 21, 2022, starting with a price trend that was able to break through the EMA/200 line and stayed at that level. The bullish trend will continue if the price breaks the EMA/200 line and also breaks the 488,336 level.

The 4-hour trend chart shows that the MACD indicator is in the negative zone and the histogram is negative, because the price of Chia Network (XCH) has experienced a fairly high increase of around 222% since June 13, 2022.
-
Storj (STORJ)
It touched the price of 5.010 on 15 June 2022 which was the lowest since listing on Indodax. The RSI indicator showed that at that time it touched the oversold area, which was a turning point for STORJ, the price immediately strengthened and strengthened further confirming that Storj entered the Bullish phase.

The MACD indicator on the 4-hour time frame showed that it was in a positive area, but the histogram was negative, which indicated that the trend was weakening and it could be seen that on June 24, 2022 a gap formed.
The weakening will test the 11,000 price. A break of that price level will further test the 8,580 level, then STORJ must stay above this price to continue the Bullish trend. The RSI indicator still needs further confirmation to confirm its next direction.
-
Binance USD (BUSD)
Using the 4-hour time frame, it can be seen that the movement of BUSD is quite volatile. It had entered the Bearish zone on June 03, 2022, but after touching the price of 14,440, BUSD immediately rebounded or reversed direction and returned to the Bullish phase after being able to break through the 14.590 price level and cross the EMA/200 line.

The MACD and RSI indicators suggested that the current trend is sideways as evidenced by the two narrowing lines. BUSD, if it weakens, there is a support level at 14.735. If this price breaks, it will open up opportunities for BUSD to test the next Bullish trend.
5 Bearish Crypto Assets
-
Fantom (FTM)
The bearish phase was marked by a break of the EMA/200 line by WMA/75 and WMA/85, which occurred on April 02, 2022. Using the 1-day time frame, the MACD indicator was in the negative area but the histogram was positive, while the RSI indicator which was previously on the oversold area had improved and away from the area.

When referring to the 1-day chart, the trend is in the Bearish Sideways phase where the movement is between the price level of 3.230 and 6,410. If one of these levels is broken and creates a candle, it will likely move to a new direction.
-
Loom Network (LOOM)
Loom was able to break through the EMA/200 line but could not break the resistance level of 1,800. Afterward, the trend reversed until it broke below the EMA/200, making the Loom Network (LOOM) in a Bearish phase. The Bearish phase made the LOOM price weakened deeper, on June 14, 2022, it touched the price of 450, which is the lowest since June 22, 2021.

A strengthening will test the 700 price level. If this price level is broken then the next trend direction will be heading towards the WMA/85 line at the 785 price level. If it weakens and penetrates the 500 price, a trend in a bearish zone is likely to be formed.
-
Coti (COTI)
The bearish phase was confirmed when the price broke below the EMA/200, the price was unable to rebound and break through the resistance line at the price of 4,870, which made the price of Coti (COTI) weaken further. After touching 1.160, the price has strengthened, the MACD and RSI indicators also showed strengthening signals and the nearest target is to break the resistance level of 1.950, the next resistance is at the level of 2.670.

-
DEAPcoin (DEP)
After the long wick candle formed, DEP touched the price of 1.070. Even though it had rebounded from the support level at 500, but the rebound, the price weakened quite deeply which made DEAPcoin (DEP) enter a Bearish phase. It tried to break the WMA/75 line at 237 but failed and the price was corrected further.

The MACD indicator is in the negative direction and the RSI indicator is weakening, the weakening will try to test the 160 price, if it fails, it will try to break the WMA/85 line at 244.
-
Algorand (ALGO)
In the 1-day time frame, ALGO was indicated to be in the Bearish Zone since January 27, 2022. It had strengthened and tried to penetrate the EMA/200, but to no avail, because it was unable to break through the price levels of 14.100 and 11.455.

The MACD indicator signals a positive trend, the trend will remain in the Bearish phase if the price is unable to penetrate the 15,700 price level. The strengthening will test the nearest resistance at 6,130. If this level is broken, then it will try to break out from 9,300.
NOTE: If the 5 EMA crosses the WMA 75, 85 and 200 EMA lines and the lines intersect from the bottom up, then the market trend tends to go up (bullish), each table above shows that if the 5 EMA value is higher than the 75.85 WMA and 200 EMA, the market tends to go up (bullish).
If the RSI and MACD values ??show the same condition, it means that the market is showing the same trend. Overbought or oversold conditions are an indicator that the market is already at the point of changing direction of a trend.
ATTENTION: All contents which includes text, analysis, predictions, images in the form of graphics and charts, as well as news published on this website, is only used as trading information, and is not a recommendation or suggestion to take action in transacting either buying or selling. certain crypto assets. All crypto asset trading decisions are independent decisions by the users. Therefore, all risks arising from it, both profit and loss, are not the responsibility of Indodax.


