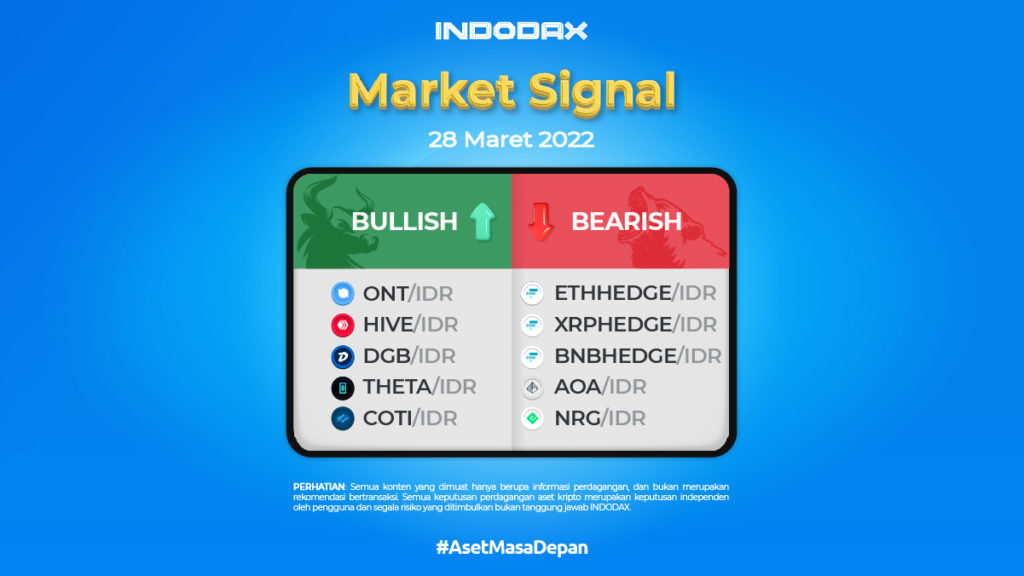
The last Monday of March 2022 comes with 5 bullish and bearish crypto assets. This time Indodax Market Signal presents Short Tokens.
This token is an FTX Leveraged Token that has leveraged exposure to crypto. Users can buy leveraged tokens like regular tokens on spot markets like Indodax. FTX maintains the Leverage Token price. Indodax is not responsible for the Leverage Token price from time to time.
Short Token is a term for crypto assets that are traded in the futures market, where even when the price of the asset drops, traders can still make profits. This is because in the world of the futures market, traders can set a number or price below the current price, and make profits when the price hits that number!
Since this token is a token of the FTX exchange, as usual, you have to find out the fundamental and technical analysis beforehand! All crypto asset trading decisions are independent decisions by the user. Therefore, all risks arising from it, whether profit or loss, are not the responsibility of Indodax.
Currently, Short Tokens such as Short Bitcoin Tokens or HEDGE and Short Ethereum Tokens or ETHHEDGE can be traded on the spot market, such as Indodax. But, how does it work? Isn’t it in the spot market, we can only make profits when the price goes up?
5 Bullish Crypto Assets
-
Ontology (ONT)
The graph that signals price increase or bullish trend can be seen on Ontology (ONT) after breaking the resistance line at the price range of between 7,600 and 7,666. The price was observed to breakout resistance on March 23. When viewed at this time the ONT/IDR pair has touched the price range of 8,600 and there has been quite a strong buying activity that has pushed the price up to the price range of 9,000.
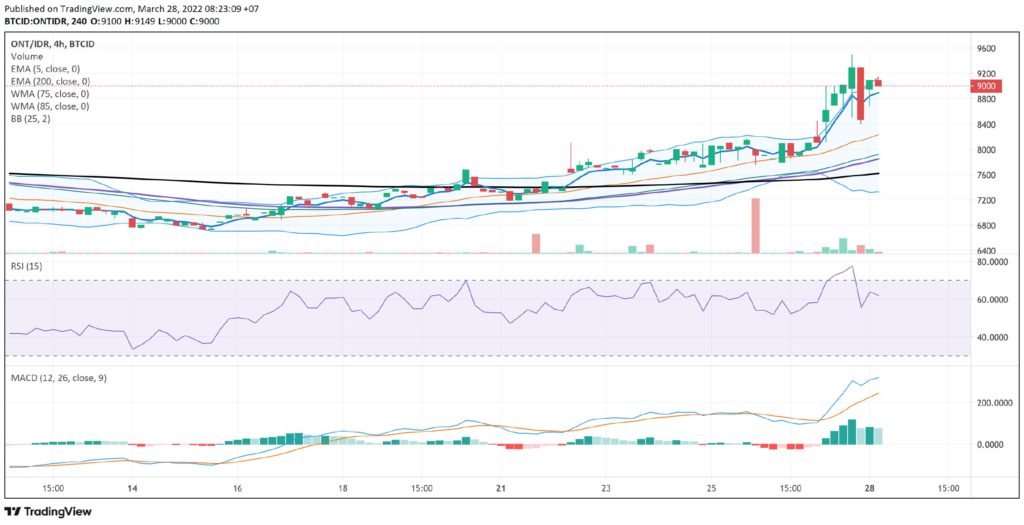
If the price continues to show a positive trend, the ONT/IDR price will move towards the 9,300 – 9,360 price range. However, if you look at the RSI indicator, it indicates that the price is overbought, which means that the price of ONT/IDR could be corrected.
ONT (Ontology), ranked 125th on coinmarketcap, is a new public blockchain project which includes a complete distribution of ledger and smart contract systems.
In the latest news, Ontology Releases Ethereum Virtual Machine and Announces $10 Million Funding To Support Web3 Developers within Ontology (ONT).
Ontology, a project that brings trust, privacy, and security to Web3 through a decentralized identity and data solution, and also announced the release of Ethereum Virtual Machine (EVM), to seamlessly connect Ontology and EVM-based ecosystems, this will improve cross-chain interoperability, enabling EVM-based blockchain developers to easily migrate across the ecosystem and build applications seamlessly within Ontology.
-
Hive (HIVE)
The price movement of HIVE has continued to show an uptrend since March 24, where the price has continued to climb up when it passed the price range of 14,000. HIVE/IDR was also confirmed positive and had risen with a thin axis to 16,000. This bullish momentum can continue if the price breaks the breakout level at 17,000- 18,000.
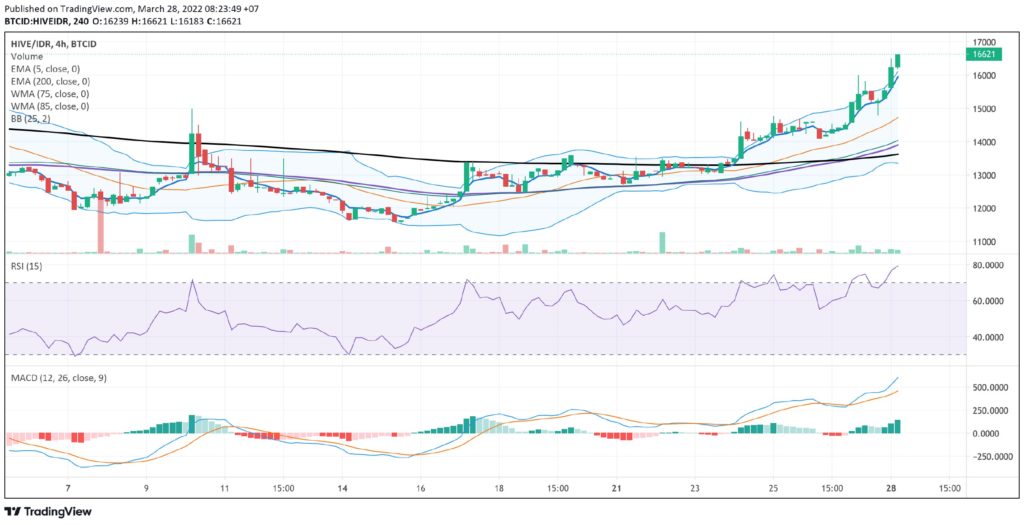
If you look at the MACD, it still shows a strengthening trend, but the price could be corrected seeing that the RSI has passed the Overbought period and will test the next support level.
Hive (Hive) is a crypto asset for open source social media which was the result of a hard fork of the Steem token after their community decided to split and form their own blockchain. According to coinmarketcap Hive was ranked 147 at the time of this writing, with a total supply of 401,245,434.51 HIVE.
-
DigiByte (DGB)
The EMA 5 line which has crossed the EMA 200, WMA 75 and WMA 80 lines, has given a signal that DigiByte has entered a Bullish phase. This phase will also continue to test the price level in the range of 395 – 430, to determine whether DGB/IDR remains on the uptrend or enters a correction phase. If the DGB/IDR correction will test the price at 310 – 315 levels, and drop from that levels, then at least DigiByte will experience a further correction.
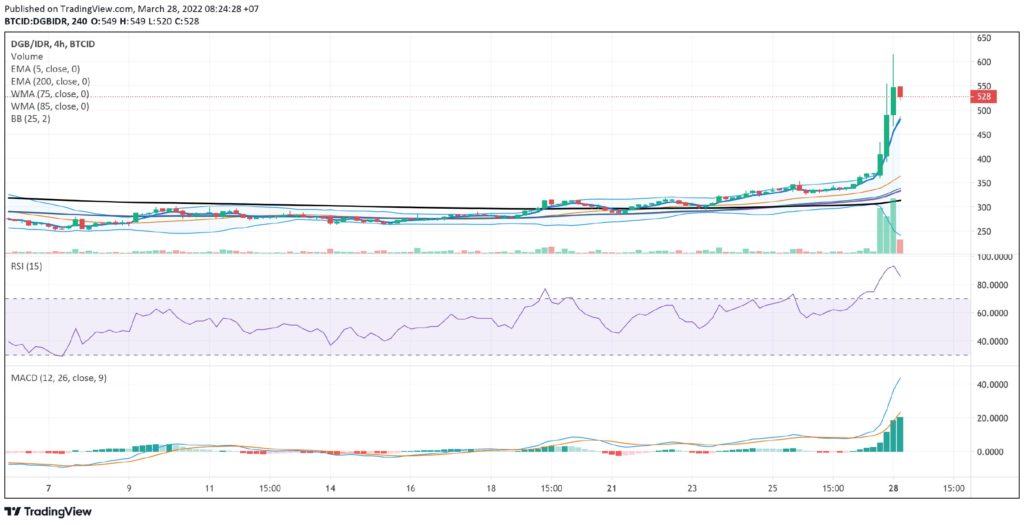
The RSI indicator with a timeframe of 4 Hours shows that DGB/IDR is already in the overbought phase. The price can still be corrected, and Buyers can make an accumulation when the correction continues.
DigiByte (DGB) is a fast-growing open-source blockchain created in late 2013 and released in early 2014 by founder Jared Tate. This asset is the oldest and longest-existing UTXO blockchain. Apart from that, it is also one of the fastest chains at almost 0 cost.
DigiByte focuses on speed, security, and scalability. With much faster block timing than other UTXO blockchains. DGB is ranked 146th. There is a circulating supply of 15,204,522,180 DGB coins and max. supply 21,000,000,000 DGB coins.
-
Theta Network (THETA)
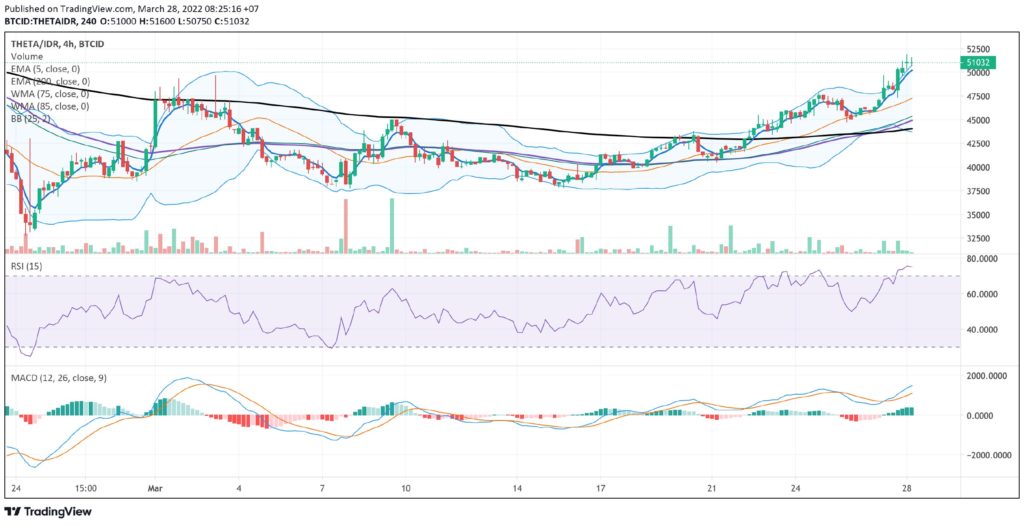
Theta Network (THETA) was able to break through the 200 EMA line at the price of 43K, which indicates that buyers are trying to be in a dominant position.
This movement is moving in the price range of between 44,500 and 50,000, where THETA/IDR will be able to confirm the next hike at the psychological level of 51,500. THETA will experience a positive movement, but this will fail if the price breaks the support level at 38,900-33,000 price range. The 4 Hours time frame of MACD and RSI indicators show quite positive indicators on THETA/IDR price movements.
Theta (THETA) is an open-source protocol that supports a decentralized video streaming network. This allows decentralized applications (DApps) to be built on top of the platform which enables videos from esports, entertainment, and peer-to-peer streaming. THETA tokens can be staked into the network to participate in block production and earn token rewards.
Theta was founded by Mitch Liu and Jieyi Long in 2018. Liu has a long history in the gaming industry, founding mobile social gaming studio Gameview, as well as Sliver.tv, an esports platform whose DApp was the first to be built on the Theta protocol. Long is the co-founder of Sliver.TV, following years of similar experience in the gaming sector.
Theta now has a modest team, and its official website lists advisors for the project including Steve Chen, co-founder of YouTube, along with co-founder of streaming platform Twitch, Justin Kan.
-
Coti (COTI)
The movement of Coti has broken the EMA/200 line on March 23 which causes COTI/IDR to be in a bullish trend. The price level at 3.180 will continue to be tested by dynamic and fluctuating movements. The price range is at the level of 3,800 – 4,000 when that level can be broken then the next level price will be 4,700.

However, this uptrend movement has already shown an overbought if you look at the RSI indicator, which indicates that the current Coti price level will determine whether it will stay in the uptrend or will undergo a correction.
Coti (COTI) is a decentralized high-performance cryptocurrency ecosystem optimized for creating digital payment networks and stable coins. Coti’s current CoinMarketCap Ranking is #186, with a market cap of IDR 3,755,240,079,502 IDR. There is a circulating supply of 1,048,141,495 COTI coins and max. supply 2,000,000,000 COTI coins.
5 Bearish Crypto Assets
-
1X Short Ethereum Token (ETHHEDGE)
1X Short Ethereum Token (ETHHEDGE) is experiencing a bearish trend, we can see this from the EMA/5 line which has cut below the EMA/200, WMA/75, and WMA/85 lines. The current price movement is the lowest since January 2022. This decline will test the price at the 196K – 199K level, to see the next price movement.
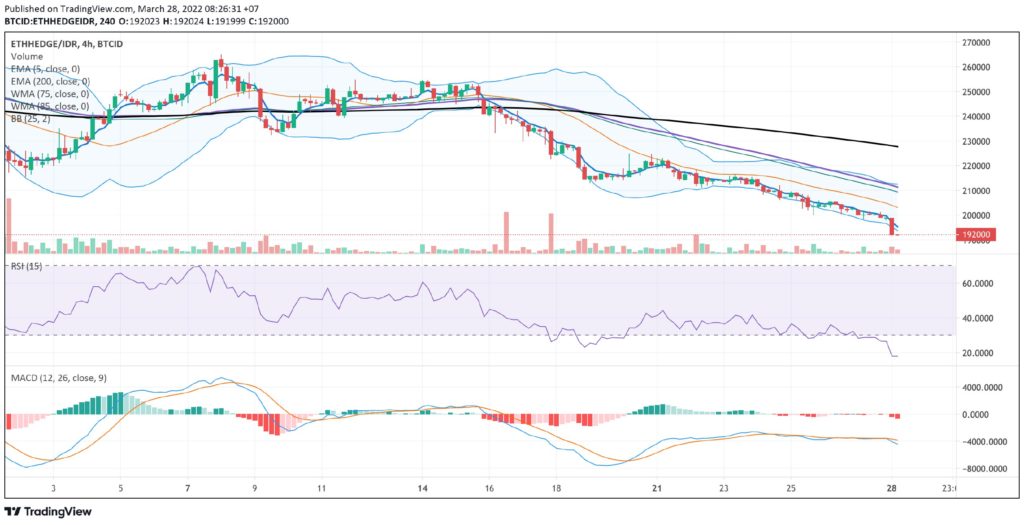
If you look at the 4 hours time frame of the RSI indicator, it shows that the price has reached the oversold level but the MACD is showing a sideways movement.
-
1X Short XRP Token (XRPHEDGE)
The chart movement of 1X Short XRP Token (XRPHEDGE) has been experiencing a decline in price since February 25, 2022 when the price crossed below the EMA/5 line at the price level of 732K – 739K.
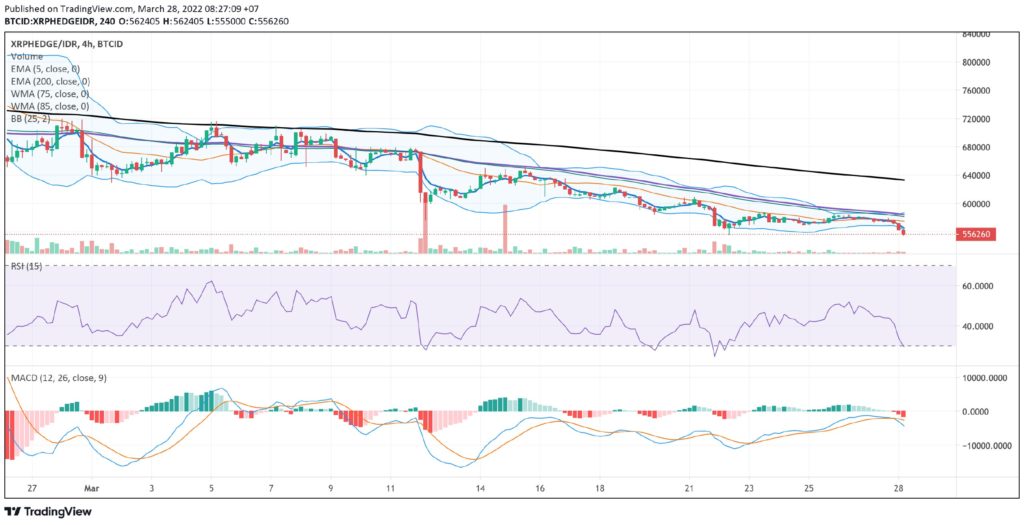
This decline will test the price level of 548K, and it will also test the MACD which is currently experiencing sideways. If the MACD shows a positive trend, the movement of XRPHEDGE/IDR will test the resistance at 739K- 811K.
-
1X Short BNB Token (BNBHEDGE)
BNBHEDGE/IDR has experienced a downtrend after breaking through the EMA/200 line after previously experiencing sideways. This downtrend period will end if the price of BNBHEDGE/IDR is able to penetrate the level of 115 thousand – 120 thousand, but if it cannot penetrate that level, it will test the support at the price of 98 thousand – 100 thousand.
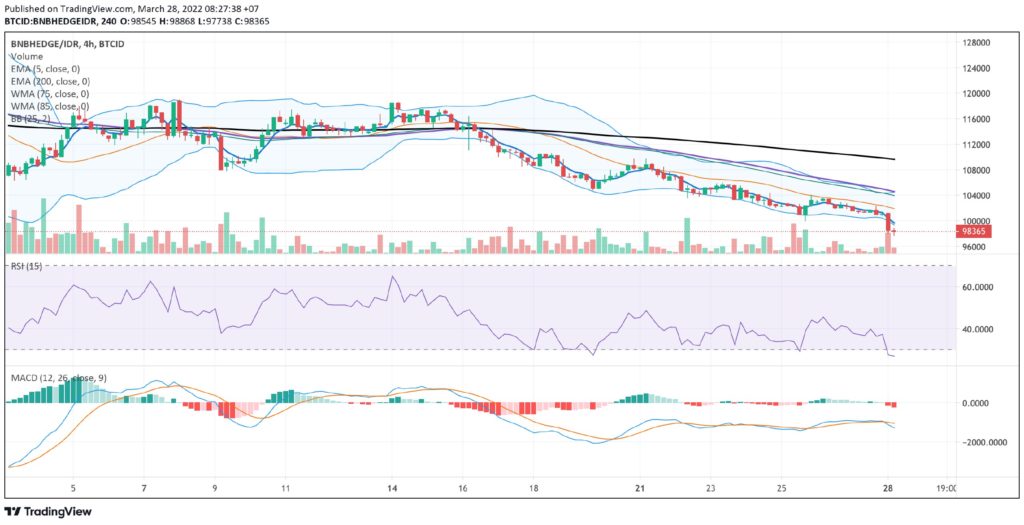
The movement of MACD shows a negative trend while the RSI indicator is heading towards the Oversold level which will test the support level mentioned above.
-
Aurora (AOA)
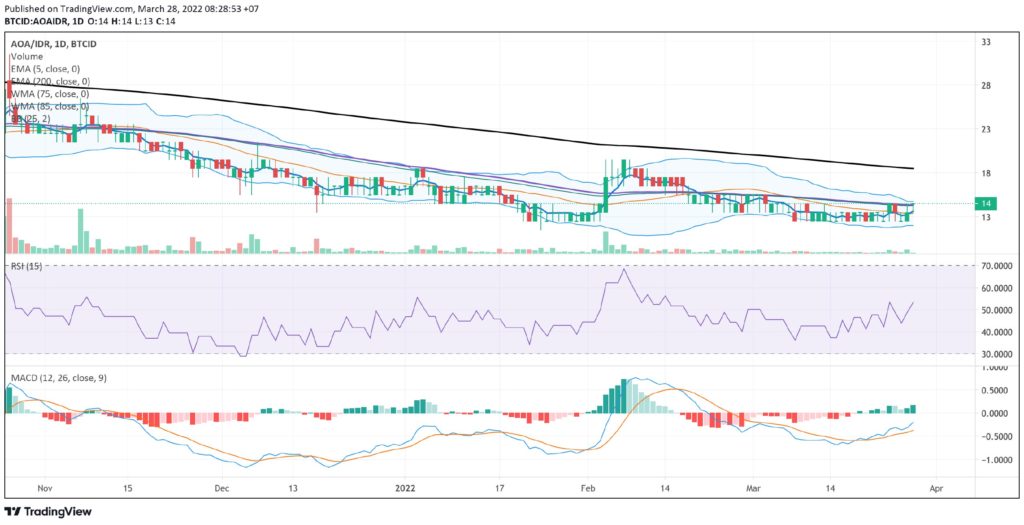
Looking at the 1-Day timeframe of the Aurora movement, it shows that the AOA/IDR price is experiencing Bearish with a price range of 14 – 12. However, if you look at the MACD indicator it indicates that AOA/IDR is experiencing an increasing price movement or an Uptrend.
-
Energy (NRG)
At the moment, Energi (NRG) is in a sideways position to test the 10.160 price level but is still in a bearish phase. An increase in the price of NRG/IDR will test the resistance level at the price of 10,980 – 11,100.
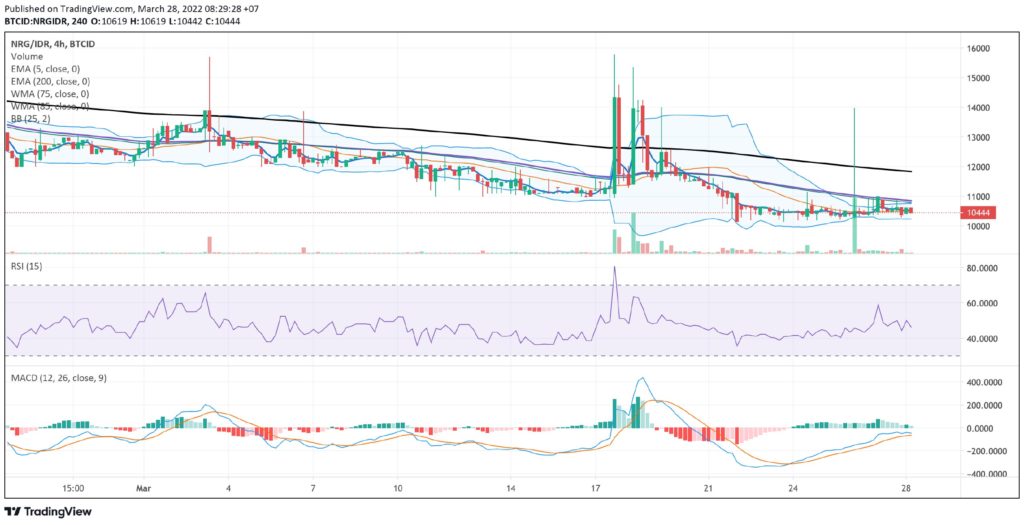
If you look at the movement of the RSI, it is already in a volatile phase where the movement is in the middle between the oversold line and the Overbought line.
NOTE: If the 5 EMA crosses the WMA 75, 85, and 200 EMA lines and the lines intersect from the bottom up, then the market trend tends to go up (bullish), each table above shows that if the 5 EMA value is higher than the 75.85 WMA and 200 EMA, the market tends to go up (bullish).
If the RSI and MACD values show the same condition, it means that the market is showing the same trend, overbought (overbought) or oversold (oversold) conditions are an indicator that the market is already at the point of changing the direction of a trend.
ATTENTION: All contents which include text, analysis, predictions, images in the form of graphics and charts, as well as news published on this website, is only used as trading information, and are not a recommendation or suggestion to take action in transacting either buying or selling. certain crypto assets. All crypto asset-trading decisions are independent decisions by the users. Therefore, all risks stemming from it, both profit and loss, are not the responsibility of Indodax.


