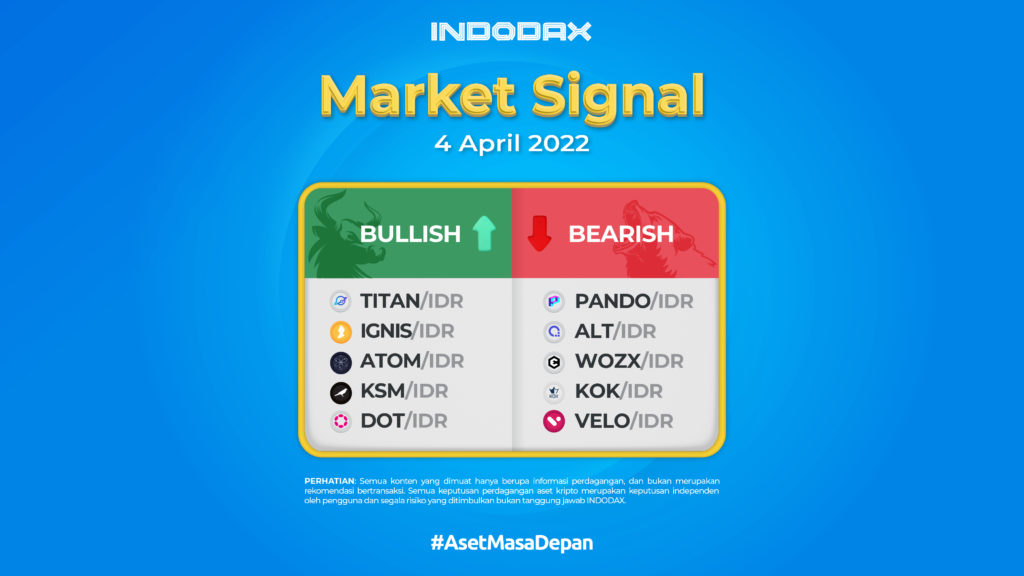
Hello Indodax friends! The first week of April 2022, there are 5 crypto assets that signal bullish and bearish trends. The first is Titanswap. Let’s check them out!
5 Bullish Crypto Assets
-
TitanSwap (TITAN)
TITAN is a crypto asset used in the liquidity pool component of TitanSwap’s Decentralized Exchange (DEX).
TITAN or Titanswap is a decentralized finance (DeFi) project that combines the features of its predecessors in a decentralized finance ecosystem. In this case, Titanswap wants to provide financial products that are completely controlled by users.
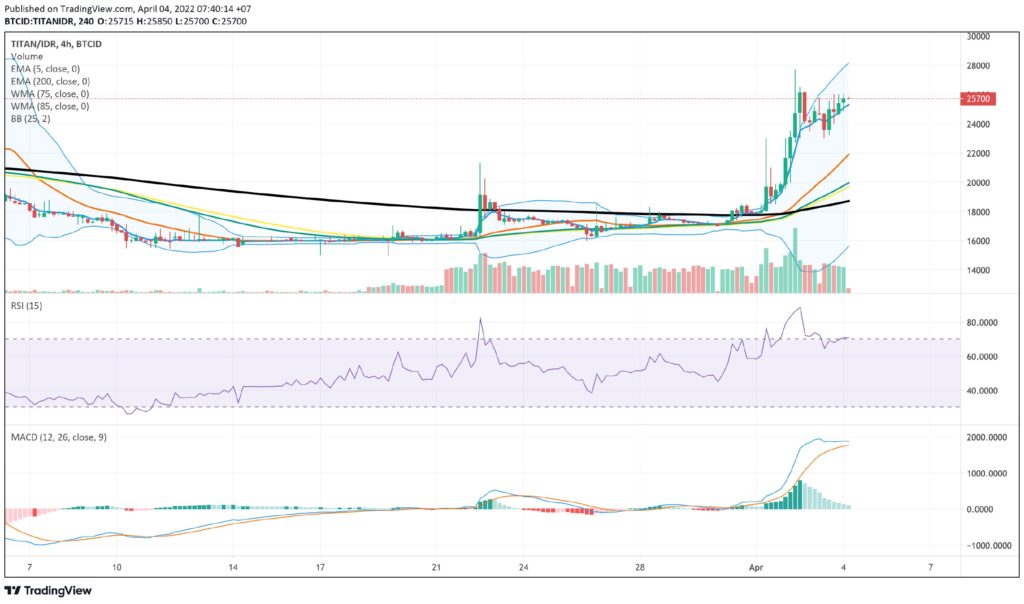
TitanSwap (TITAN) has entered a bullish phase after being able to break the resistance line at the price range of 19 thousand. If you look back, before Titanswap was able to break the breakout line, a sideways phase occurred in the time span of March 23, 2022 to April 01, 2022 where sideways were in the price range of 16 thousand – 19 thousand.
The movement of TITAN/IDR, when looking at the RSI indicator, has passed the overbought phase. If it declines, it will test the nearest area at the price range of 23 thousand – 22 thousand.
-
IGNIS (IGNIS)
Other than Titanswap, In the 4H timeframe, the movement of IGNIS/IDR is increasing, where the RSI indicator is already trying to climb and break through the overbought line. This is also in line with the MACD indicator which shows a positive movement.
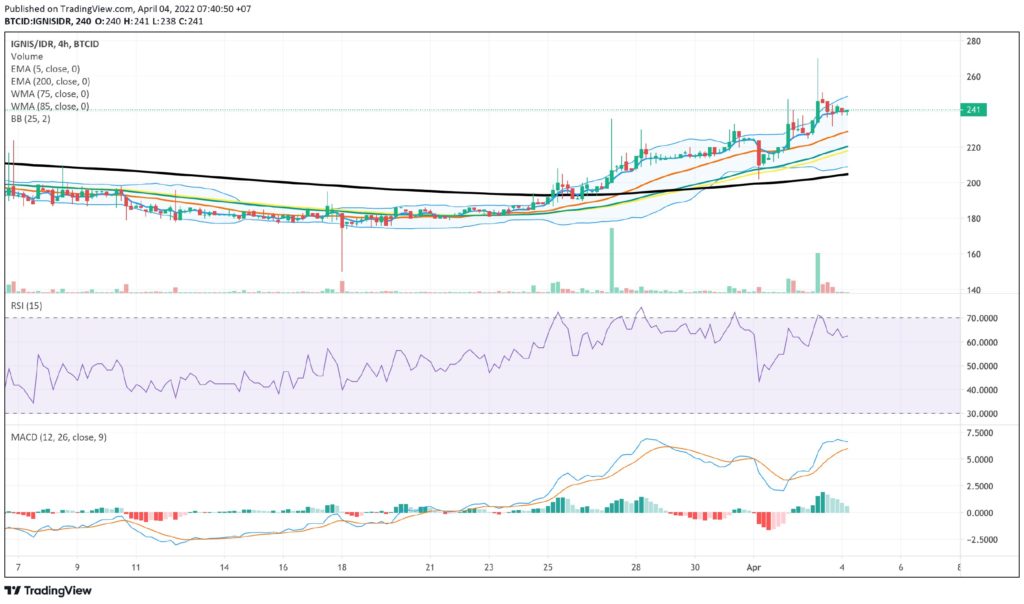
If the movement of IGNIS/IDR continues to increase and the trend is increasing, then the next resistance line will be tested at 310 – 360.
-
Cosmos (ATOM)
Cosmos (ATOM) in the 4-hour time frame has entered a bullish phase, this can be ascertained because the EMA 5 line has crossed the EMA 200, WMA 75 and WMA 80 lines. The increase in this movement will test the price range of 497K with a note that this movement is accompanied by a candlestick body and not just the wick. However, if the ATOM/IDR is corrected, it will continue to test the price range of 434 thousand.
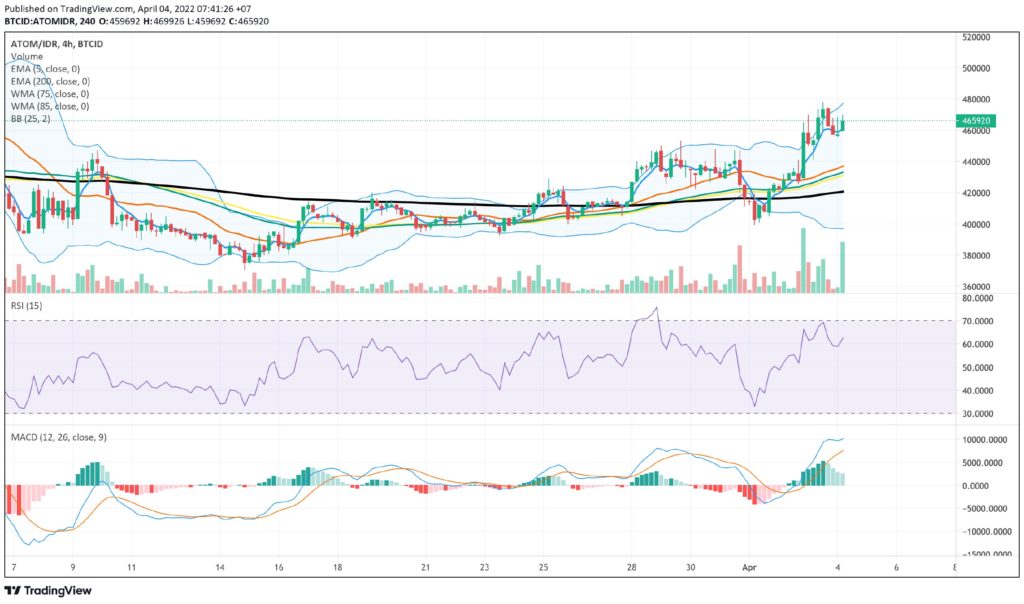
The MACD indicator, where the blue line has crossed upwards and is also marked by the crossing of the 5 EMA line that was discussed earlier, indicates that ATOM/IDR has entered a strong uptrend phase.
-
Kusama (KSM)
Kusama (KSM) is an experimental Polkadot crypto asset created to test and improve aspects of functionality, interoperability and scalability prior to deployment on the Polkadot network. KSM is ranked 67th with the price at the time this article was written in the range of Rp.2,923,610.-
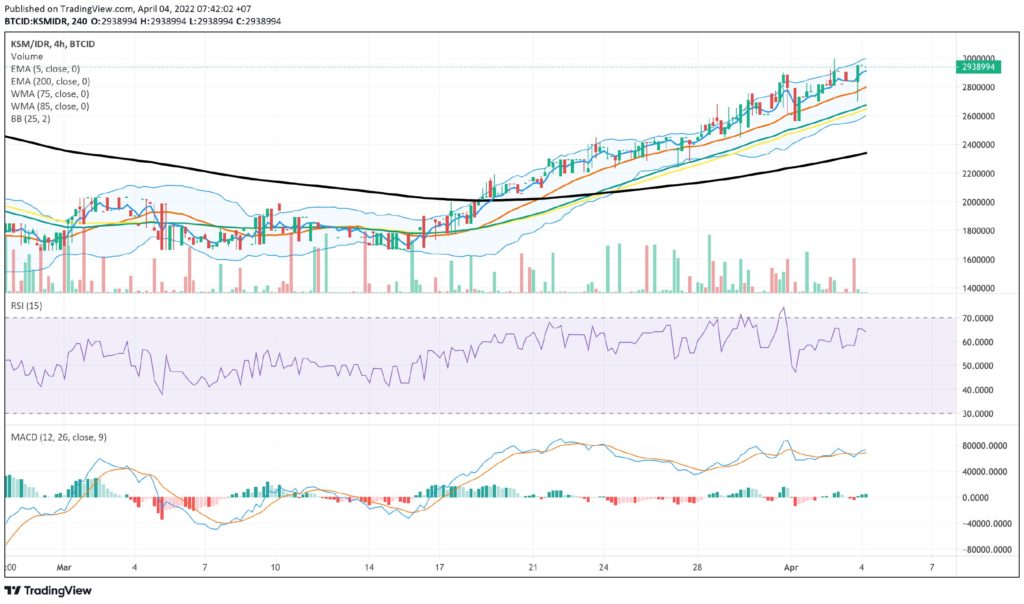
If you look at the trend chart from Kusama (KSM), this trend has shown indications of an uptrend since EMA 5 which was able to cut the EMA 200 and above which occurred on the day of March 19, and this was also followed by WMA 75 and WMA 85 which crossed the upward line. The 200 EMA is in the range of March 23 – March 24.
An increase in KSM/IDR will test the price of 4 million to determine whether it will form a new price pattern or not, but if it experiences a correction it will test the price of 2.5 million.
-
Polkadot (DOT)
Polkadot (DOT) is a project planned by the Web3 Foundation, a Swiss foundation with the mission of maintaining and managing technologies and applications in the field of decentralized web software protocols, especially those that utilize modern cryptographic methods to maintain decentralization, for the sake of and stability of the Web3 ecosystem. DOT is ranked 11* with a price of IDR 337,330,-. The total supply is 987,579,314 DOT.
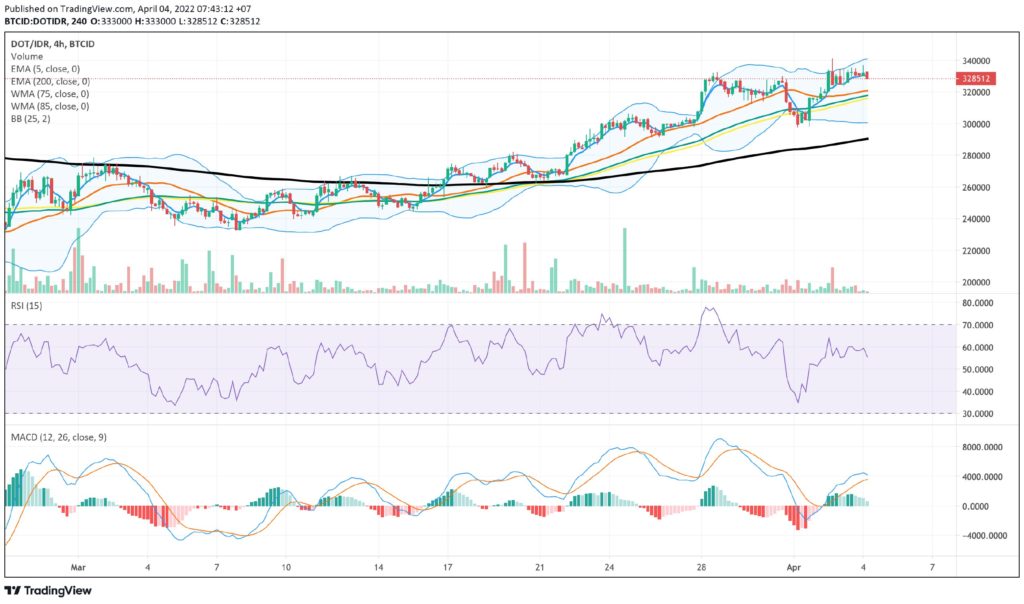
The price of DOT/IDR once touched the price range of 298 thousand – 296 thousand, which was the lowest price since March 28. However, this price continued to increase slowly until there was a candle wick at the price of 341 thousand, which became the highest price of Polka-dot (DOT) since February 2022. If there is a correction there is quite strong support in the price range of 291 thousand – 290 thousand.
The increase in DOT/IDR prices has the potential to increase, considering the MACD indicator which shows a positive movement.
5 Bearish Crypto Assets
-
Pando (PANDO)
Pando is a blockchain project that aims to achieve internet transparency by providing convenience, accessibility and compensation to users who actually contribute to expanding the 3rd generation internet, WEB 3.0.
To achieve this goal, Pando started with Pando Browser which is an ad-free web browser. Starting from Pando Browser, we will create messenger, SNS, games, Pando Market. There are also other web-related business models for creating a healthy ecosystem. This is to compensate all users who are willing to contribute to expanding the Pando platform.
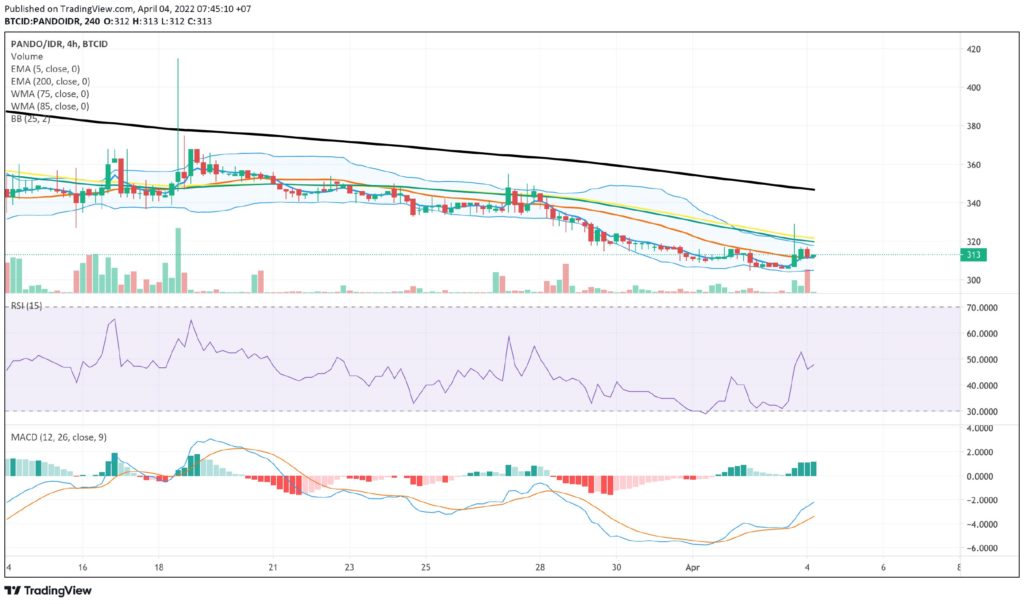
If the price movement of Pando (PANDO) is pulled back a few months, Pando (PANDO) has experienced a downtrend since the range of January 2022 until now it remains in the same phase. If the price goes up to continue the upward trend then there is a fairly strong resistance in the 330 price range.
The MACD indicator shows that the trend of PANDO/IDR is narrowing which means it is on a sideways phase, if PANDO/IDR breaks through 305, it is estimated that the price will test the next support level.
-
Alitas (ALT)
The movement of the Alitas chart (ALT) has been sideways or flat since March 7th, 2022, but at a certain point, such as March 26, 2022, prices fluctuate due to the high demand and supply levels.
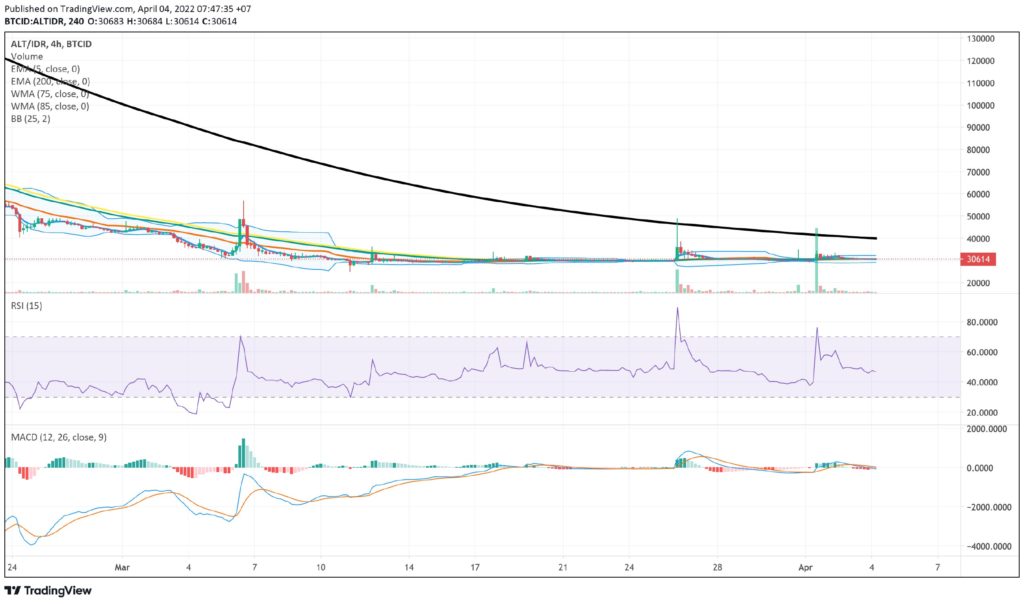
This decline is quite in line with the MACD indicator at the 4-hour timeframe level, where the price movement is shown to be negative and will be further confirmed by the Bollinger Bands indicator.
-
Efforce (WOZX)
After hitting the highest price of 2600 in March 2022, but then the movement of the WOZX/IDR chart reversed and is now in the downtrend phase. This is because selling is higher or more dominant than buying.
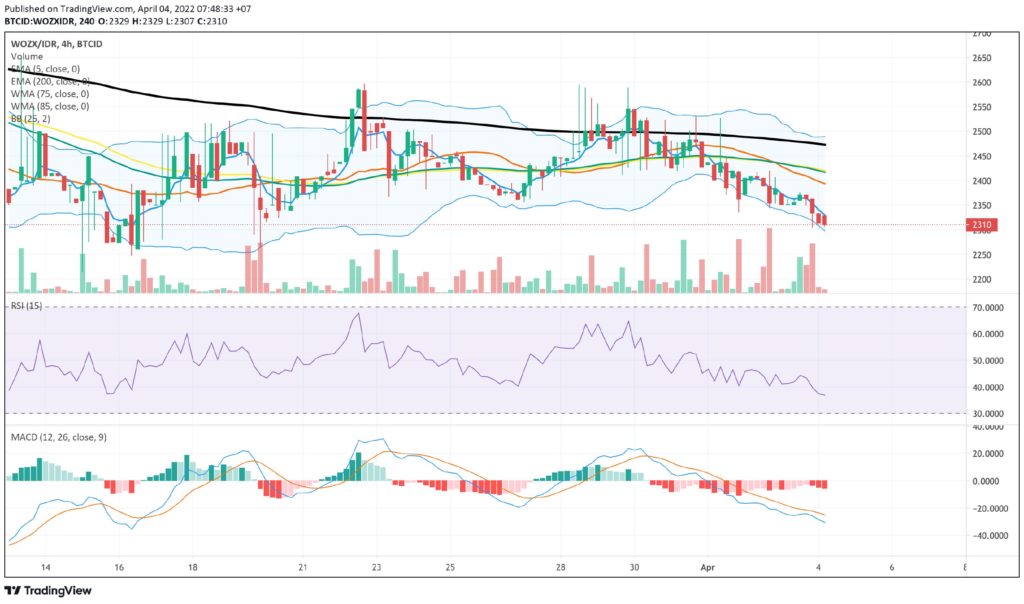
The decline in Efforce (WOZX) price requires further confirmation, but there is a support line at the price range of 2270 – 2250. For further confirmation, it can be seen that the MACD indicator is showing a negative price trend, so to confirm a rebound or price reversal, you need to look at the RSI indicator.
-
Kok (KOK)
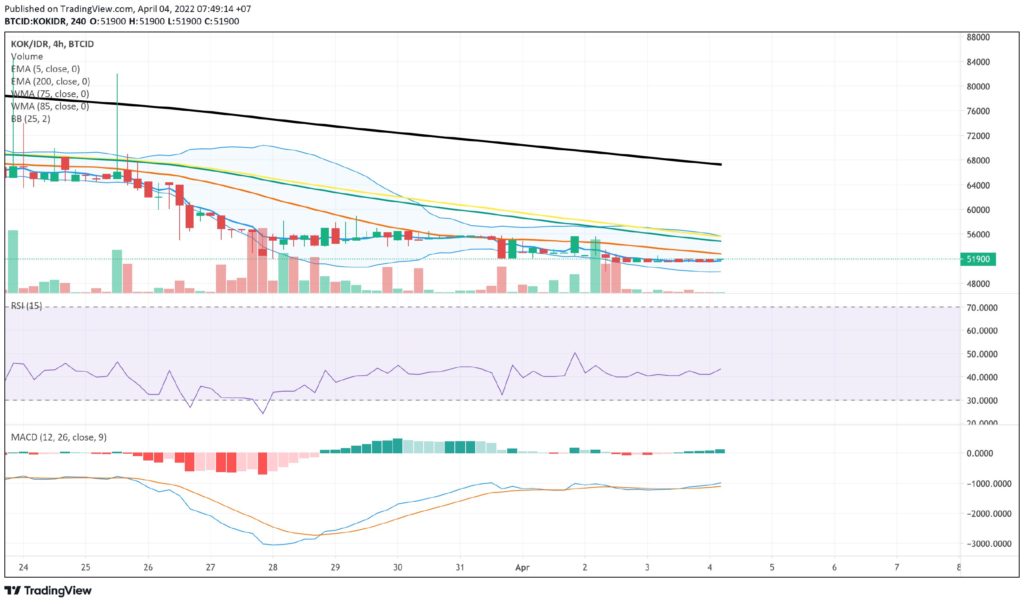
From the movement chart with a time frame of 4 hours, it indicates that KOK/IDR is in a downtrend phase combined with sideways positions. It is said to be downtrend because the EMA 5 line crosses below the EMA 200, WMA 75 and WMA 85, and can be said to be sideways because if you look at the MACD indicator it shows a narrowing chart, thus requiring further confirmation which can be combined with the RSI indicator and Bollinger Bands.
-
VELO (VELO)
Velo had reached its highest price at 800 on March 25, 2022. The highest since March 03, 2022. However, after reaching that price, the movement of VELO/IDR experienced quite high fluctuations until it was in a bearish phase.
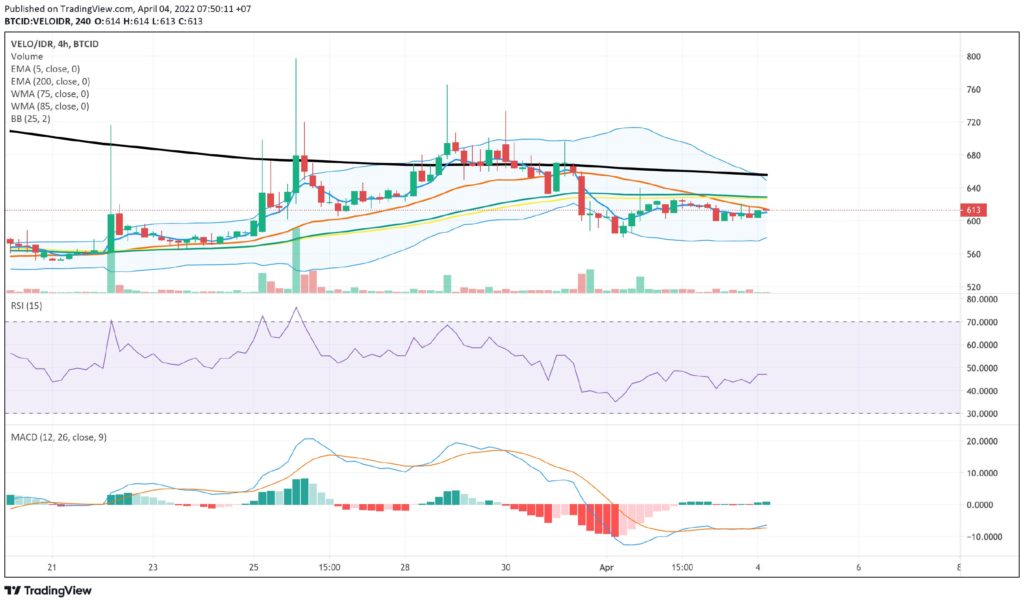
This price decline will test the support level at 550. If you look at the MACD indicator, it is showing a narrowing of the line or sideways, and positive or negative movements can be combined by looking at the RSI indicator.
NOTE: If the 5 EMA crosses the WMA 75, 85, and 200 EMA lines and the lines intersect from the bottom up, then the market trend tends to go up (bullish), each table above shows that if the 5 EMA value is higher than the 75.85 WMA and 200 EMA, the market tends to go up (bullish).
If the RSI and MACD values show the same condition, it means that the market is showing the same trend, overbought (overbought) or oversold (oversold) conditions are an indicator that the market is already at the point of changing the direction of a trend.
ATTENTION: All contents which include text, analysis, predictions, images in the form of graphics and charts, as well as news published on this website, is only used as trading information, and are not a recommendation or suggestion to take action in transacting either buying or selling. certain crypto assets. All crypto asset-trading decisions are independent decisions by the users. Therefore, all risks stemming from it, both profit and loss, are not the responsibility of Indodax.


