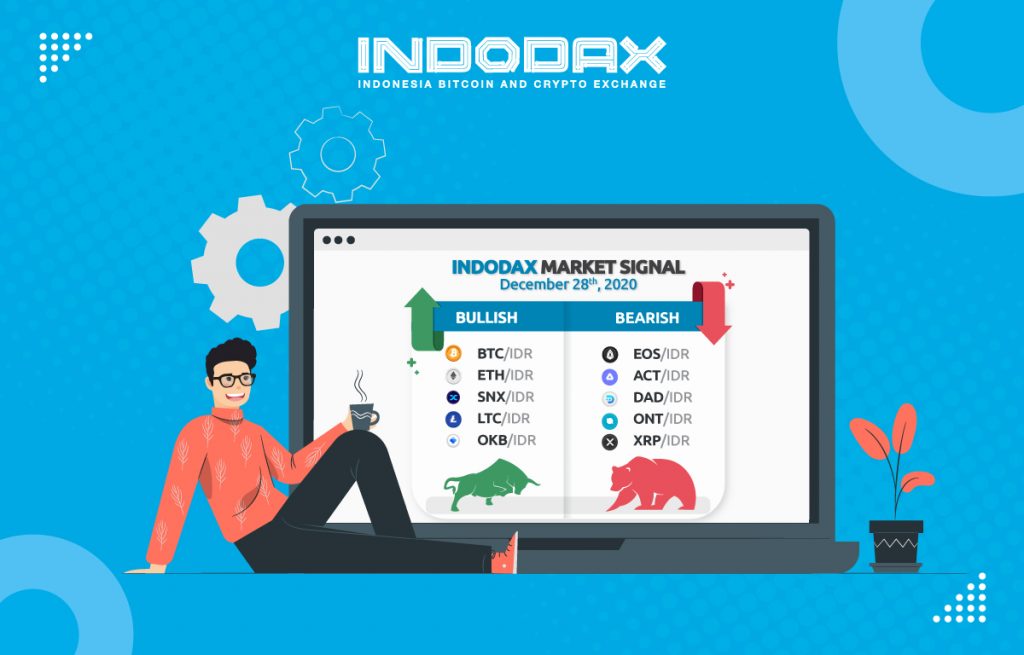
Five bullish and bearish crypto assets this time is different from the previous week. What crypto assets have gone up? Then, what crypto assets have fallen? The following is a review of Indodax Market Signal.
Bitcoin continues to set record highs. On Sunday night, December 27, 2020, Bitcoin reached IDR 400 million. This is the highest price (All day high / ADH) in history.
Bitcoin’s rise also lifted Ethereum and Litecoin’s crypto assets. Because when viewed from the chart, these two crypto assets are similar to Bitcoin price movements.
The rally or price increase will continue for these coins. This week, Bitcoin, Ethereum and Litecoin are predicted to increase again.
Meanwhile, there are also some crypto assets that are bearish. One of them is XRP, which has fallen sharply last week, will also drop this week.
The following is a complete explanation of bullish and bearish crypto asset predictions from December 28, 2020 to January 3, 2020.
5 Crypto Assets Bullish on This Week
- Bitcoin (BTC)
On the previous Sunday, Indodax Market Signal predicted that Bitcoin would record its highest every day. It also exceeds the expectation that the predicted increase in Bitcoin is only up to USD20,000. In fact it has passed USD27,000.
This increase in the price of Bitcoin occurred because of the massive purchases that have occurred recently. Microstrategy Inc., Tudor Investment Corp, and others bought Bitcoin with fantastic figures, trillions of Rupiah.
The impact of this purchase will still be felt until the end of 2020. In fact, many analysts predict that the increase will also occur until 2021.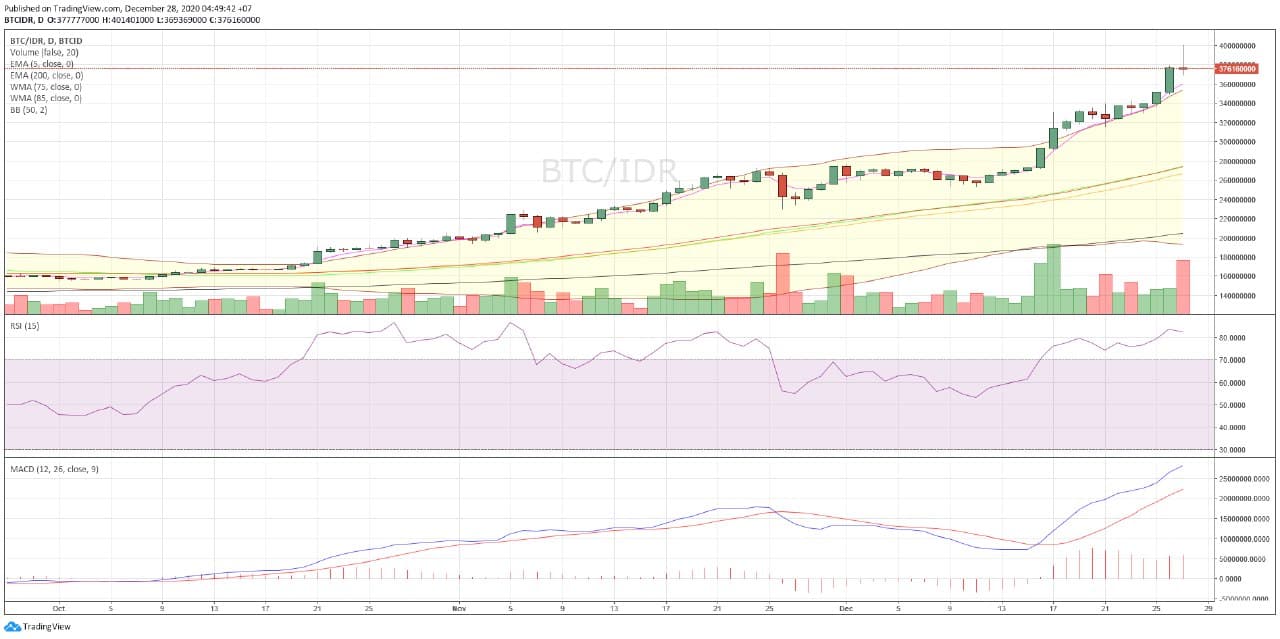
Chart Bitcoin/IDR
In today’s trading, BTC moved at the lowest level of IDR 369,369,000 and the highest level was IDR 401,401,000.
Here’s BTC’s technical analysis this week:
| action | ||
| EMA 5 | 360,157,076 | buy |
| WMA 75 | 274,185,914 | buy |
| WMA 85 | 266,747,718 | buy |
| EMA 200 | 204,692,050 | buy |
| RSI (15) | 82.3805 | overbought |
| MACD 12,26 | 28213407.11 | Buy |
| Summary | BUY (5) Overbought (1) | |
| bullish |
- Ethereum (ETH)
Another bullish crypto asset is Ethereum (ETH). The increase in Bitcoin price was also followed by Ether (ETH). Although the increase is not as high as in 2018, which is past IDR 18,000,000.
However, this crypto asset continues to post significant price increases. This week, the price will also continue to rise.
ETH purchases will also occur massively because the evolution of Ethereum 2.0 has started at the end of this year, although it is done gradually. So that the ETH price movement will also still be lifted.
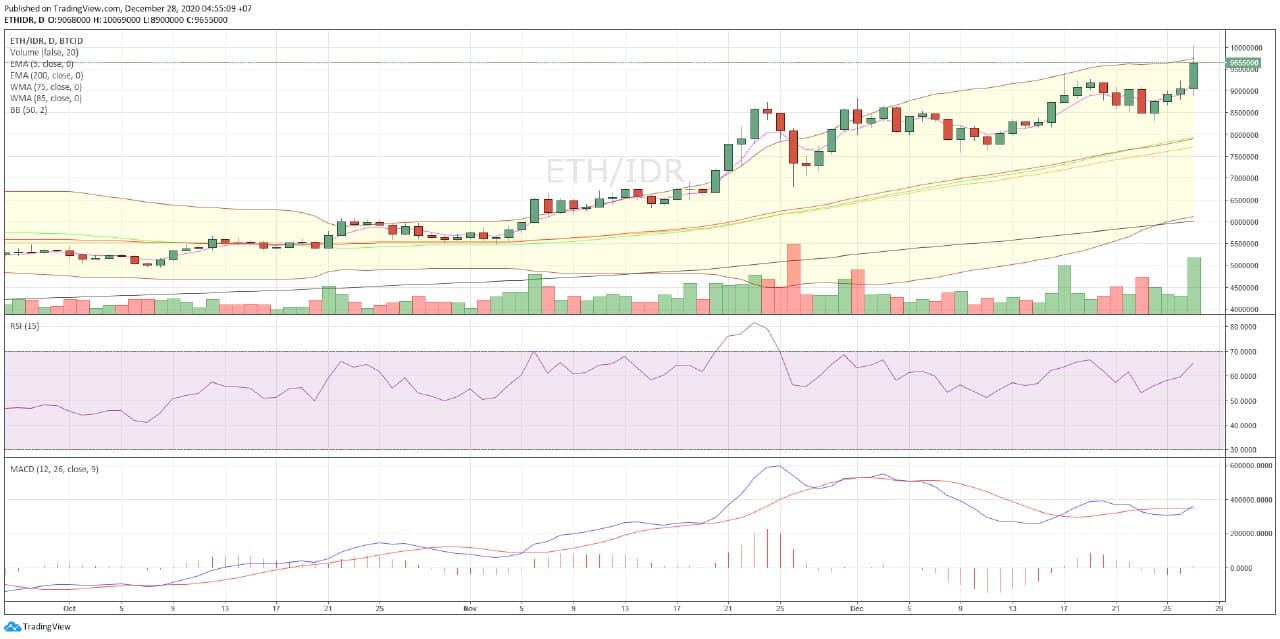
Chart ETH/IDR
In today’s trading, ETH moved at the lowest level of IDR 8,900,000 and the highest level was IDR 10,000,000. ETH entered into 5 bullish crypto assets this week.
Here’s the ETH technical analysis for this week:
| action | ||
| EMA 5 | 9,156,522 | buy |
| WMA 75 | 7,901,218 | buy |
| WMA 85 | 7,721,339 | buy |
| EMA 200 | 6,013,111 | buy |
| RSI (15) | 65.342 | buy |
| MACD 12,26 | 358395.4915 | buy |
| Summary | BUY | |
| bullish |
- Synthetix (SNX)
SNX is predicted to be bullish this week. The DeFi platform is being loved a lot thanks to its innovation which has attracted the attention of investors and traders.
Synthetix is ??a platform that creates and creates synthetic tokens or assets by developing a blockchain-based payment system. Synthetix Network Token (SNX) is built on top of the Ethereum network.
SNX aims to combine all the benefits of decentralization with the stability of traditional financial assets allowing users to perform conversions directly with smart contracts.
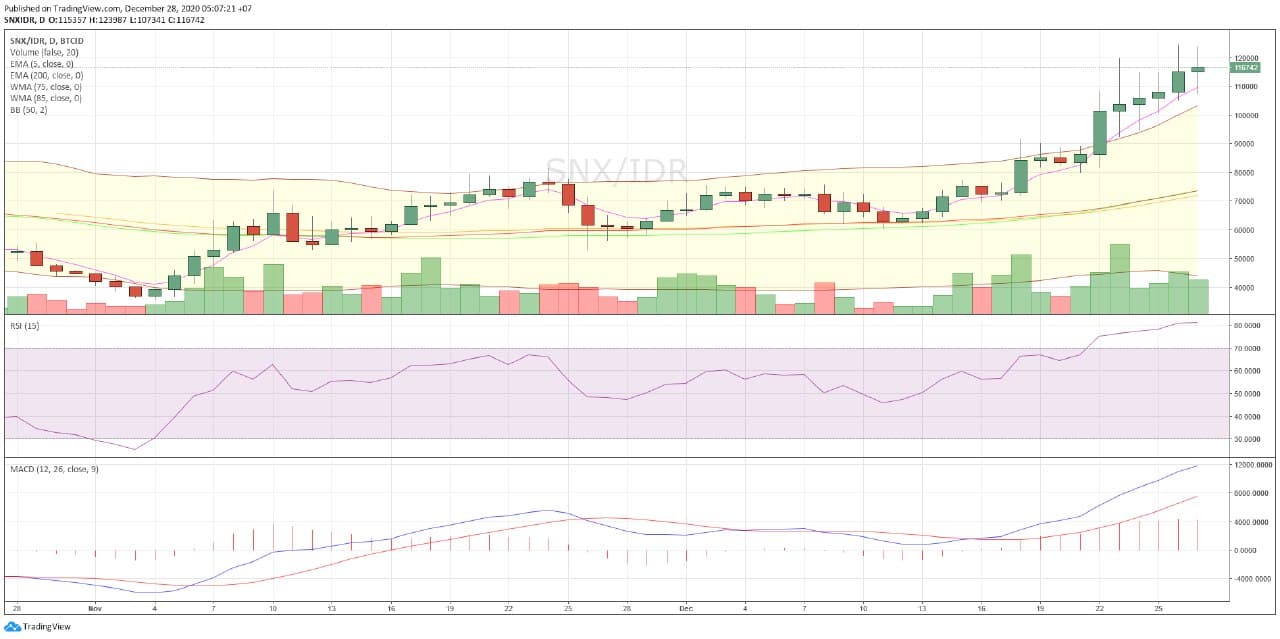
Chart SNX/IDR
In today’s trading, SNX moved at the lowest level at IDR107,341 and the highest level at IDR123,987. SNX is among the 5 bullish crypto assets this week.
Here’s the SNX technical analysis for this week:
| action | ||
| EMA 5 | 109,615 | buy |
| WMA 75 | 73,620 | buy |
| WMA 85 | 71,925 | buy |
| EMA 100 | 74,617 | buy |
| RSI (15) | 81.4021 | overbought |
| MACD 12,26 | 11871.2495 | buy |
| Summary | buy (5) overbought (1) | |
| bullish |
- Litecoin (LTC)
Litecoin (LTC) is the next crypto asset to be bullish this week. As the price of Bitcoin increases, the price of LTC also goes up.
This is because Litecoin is one of the crypto assets derived from Bitcoin Core QT. This means that everything in Litecoin is not that different from Bitcoin. As with Bitcoin, LTC is also predicted to be overbought.
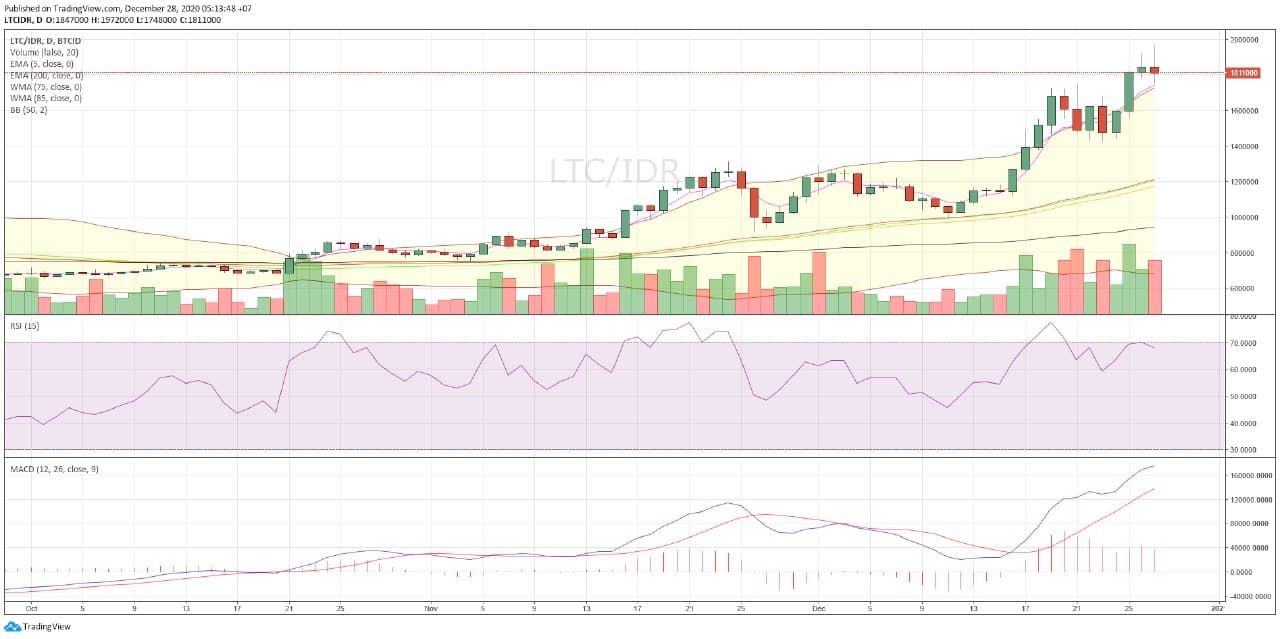
Chart LTC/IDR
In today’s trading, LTC moved at the lowest level of Rp1,748,000 and the highest level was Rp1,972,000. LTC entered into 5 bullish crypto assets this week.
Here’s LTC’s technical analysis for this week.
| action | ||
| EMA 5 | 1,741,978 | buy |
| WMA 75 | 1,213,913 | buy |
| WMA 85 | 1,175,809 | buy |
| EMA 200 | 944,388 | buy |
| RSI (15) | 68.0785 | buy |
| MACD 12,26 | 175895.8482 | buy |
| Summary | BUY | |
| bullish |
- OK Blockchain (OKB)
Crypto assets that are bullish also include OKB. OKB (OKB) is a global utility token issued by the OK Blockchain Foundation.
OKB is a token economy system designed and launched by a world-class development team based on blockchain technology.
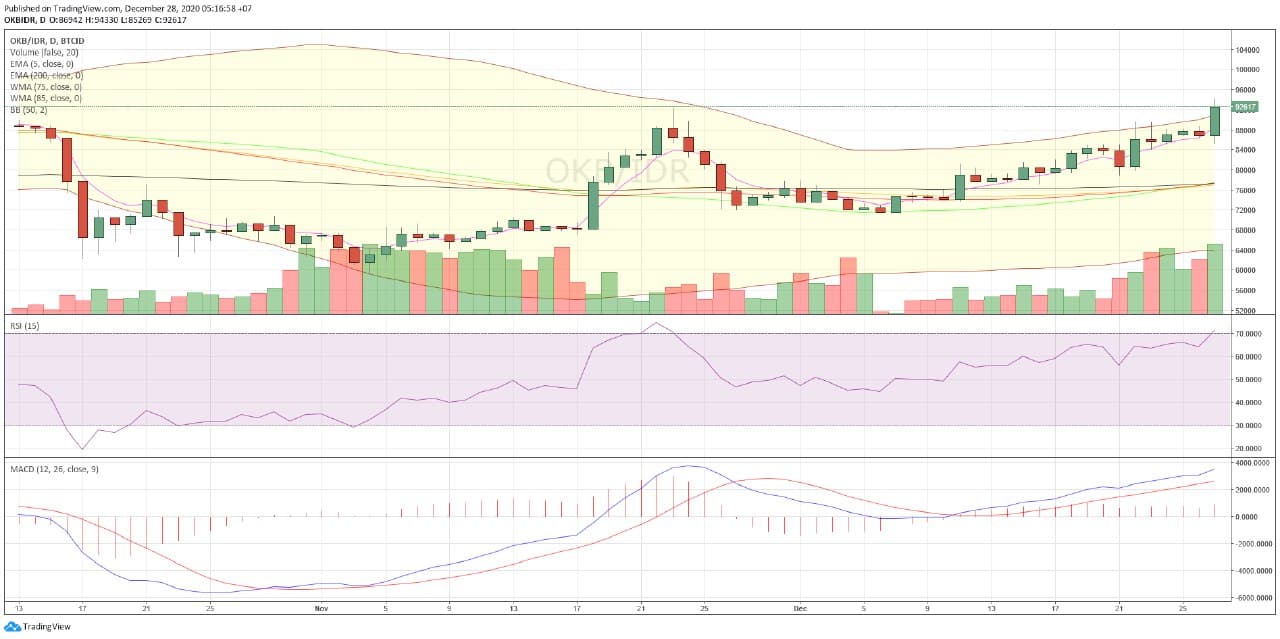
Chart OKB/IDR
In today’s trading, OKB moved at the lowest level at IDR85,296 and the highest level at IDR94,330. OKB entered into 5 bullish crypto assets this week.
Here’s OKB’s technical analysis for this week:
| action | ||
| EMA 5 | 88,432 | buy |
| WMA 75 | 77,385 | buy |
| WMA 85 | 77,034 | buy |
| EMA 200 | 77,234 | buy |
| RSI (15) | 71.0811 | buy |
| MACD 12,26 | 3497.7418 | buy |
| Summary | BUY | |
| bullish |
5 Crypto Assets Bearish on This Week
- EOS
The EOS community does not seem to want to put hopes in this crypto asset. EOS is predicted to be bearish this week. This crypto asset is a DeFi-based crypto asset.
EOS is a native crypto asset for the blockchain platform EOS.IO with smart contract capabilities. Block.one company created EOS.IO in September 2017 and now has more than 100 dapps with thousands of daily active users.
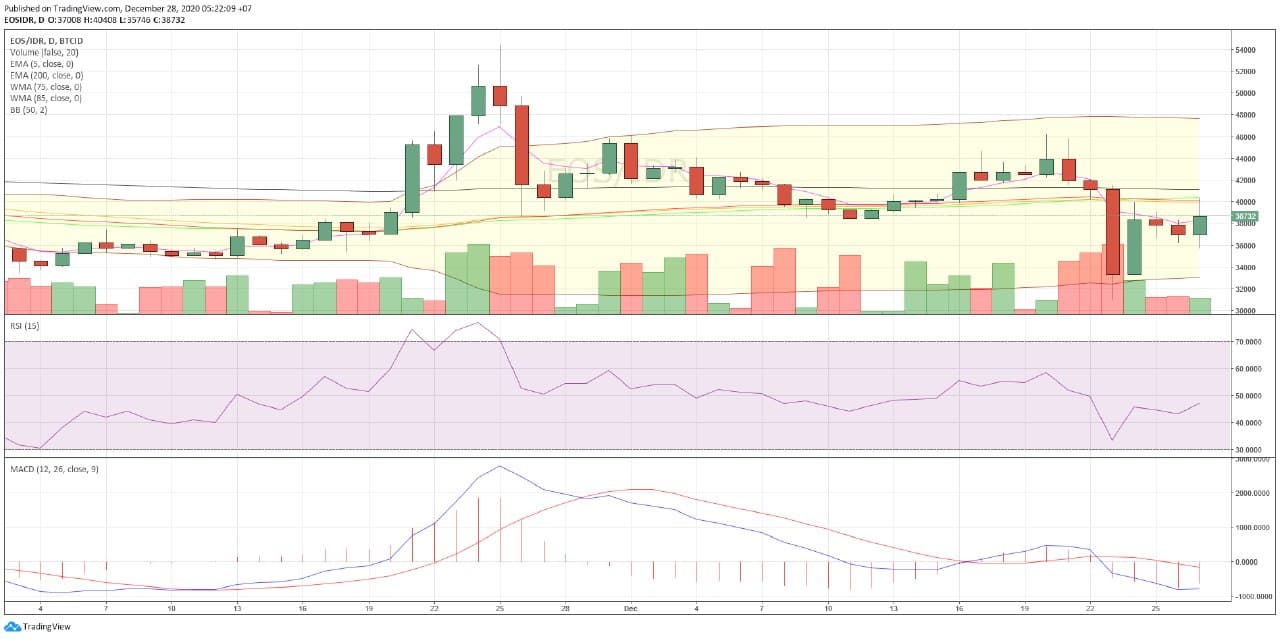
Chart EOS/IDR
In mid-year trading, EOS moved at the lowest level of IDR 35,746 and the highest level of IDR 40,408.
Here’s the EOS technical analysis for this week:
| action | ||
| EMA 5 | 38,275 | sell |
| WMA 75 | 40,141 | sell |
| WMA 85 | 39,955 | sell |
| EMA 200 | 41,117 | sell |
| RSI (15) | 47.0893 | buy |
| MACD 12,26 | -791.3423 | sell |
| Summary | SELL (5) BUY (1) | |
| bearish |
- Achain (ACT)
Achain (ACT) is the next crypto asset to experience a price drop. Achain is a public blockchain platform that aims to enable developers of all experience levels to issue tokens, smart contracts, and create applications.
The Achain team is committed to building a global blockchain network for information exchange and value transactions.
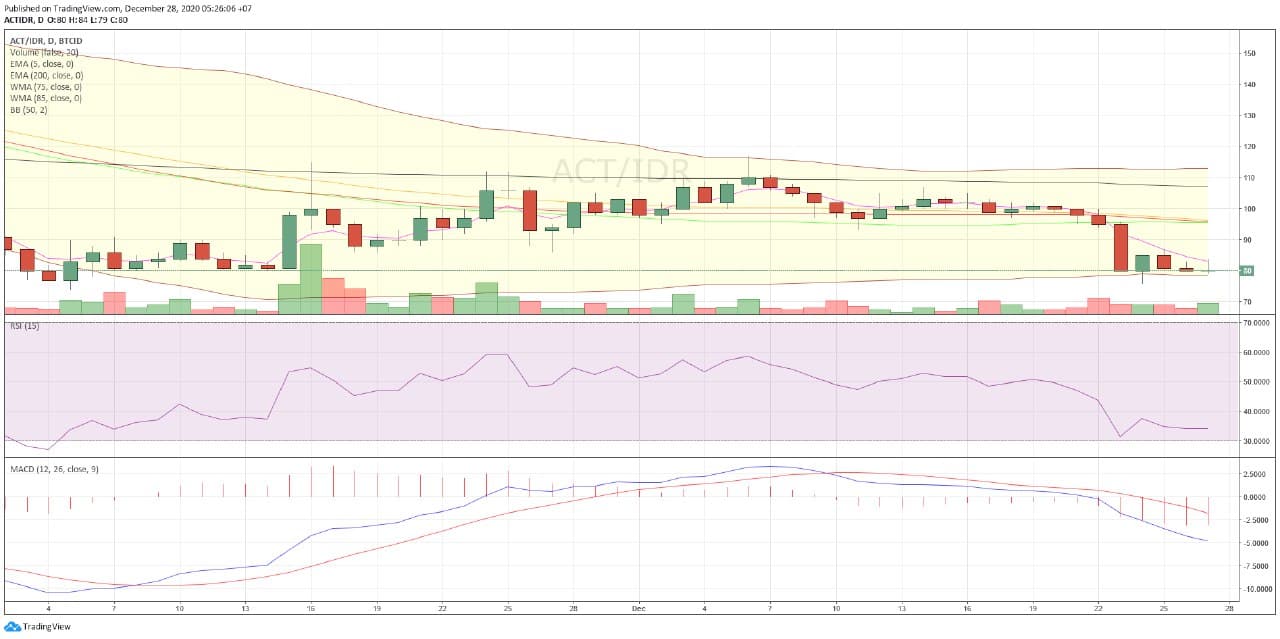
Chart ACT/IDR
In today’s trade, ACT moved at the lowest level of IDR 79 and the highest level of IDR 84.
Here’s ACT’s technical analysis for this week:
| action | ||
| EMA 5 | 83 | sell |
| WMA 75 | 95 | sell |
| WMA 85 | 96 | sell |
| EMA 200 | 106 | sell |
| RSI (15) | 34.2804 | sell |
| MACD 12,26 | -4.7731 | sell |
| Summary | SELL | |
| bearish |
- DAD
Just like the previous week, the decline in DAD will continue this week. DAD is a crypto asset that stands for Digital Advertisement.
DAD is a crypto asset based on a blockchain-based advertisement company from Singapore. DAD’s innovations have not been able to boost demand, so DAD will experience a price decline.
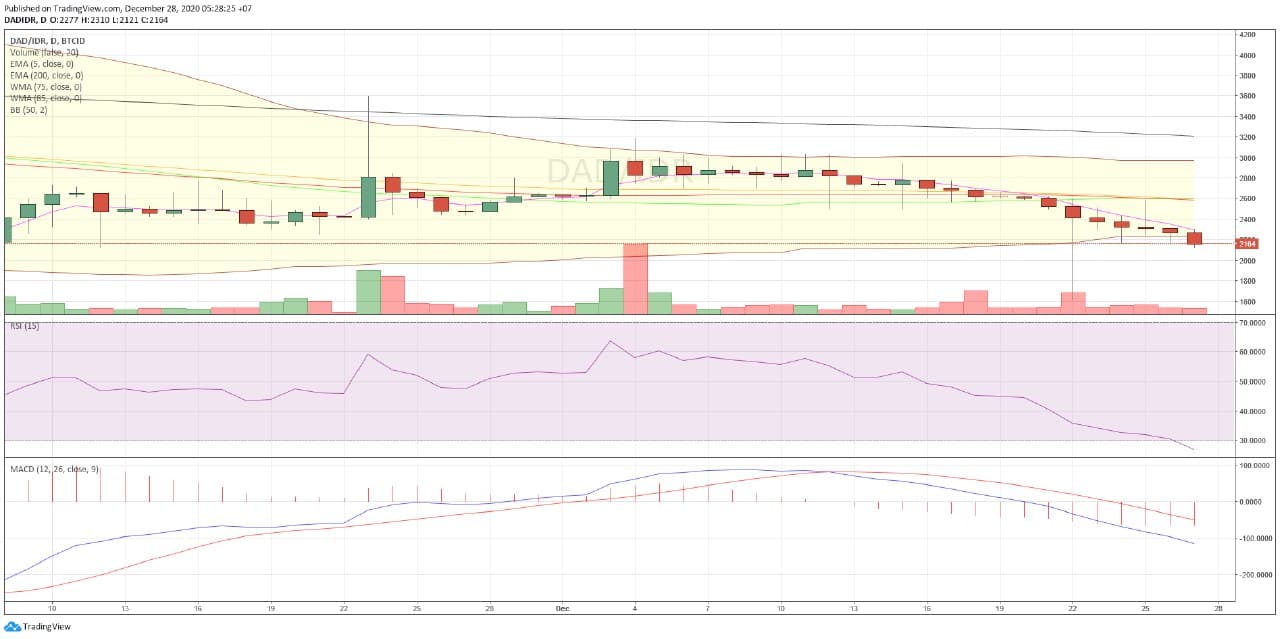
Chart DAD/IDR
In today’s trading, DAD’s lowest price was at the level of Rp2,121 and the highest price was Rp2,315.
The following is DAD’s technical analysis for this week:
| action | ||
| EMA 5 | 2,292 | sell |
| WMA 75 | 2,582 | sell |
| WMA 85 | 2,593 | sell |
| EMA 200 | 3,211 | sell |
| RSI (15) | 26.8044 | sell |
| MACD 12,26 | -114.7136 | sell |
| Summary | SELL | |
| bearish |
- Ontology (ONT)
The next bearish crypto asset is Ontology (ONT). He has not been able to improve his good performance until the price drops this week.
Ontology was created in 2017 by a Chinese company called OnChain, which is led by its founders Erik Zhang and Da HongFei. OnChain has had great success in the cryptocurrency industry as they are also the founders behind the NEO blockchain, which is now a billion dollar project.
Essentially, Ontology was created as a way for businesses of all sizes to install blockchain technology in their business without having to change all the systems that are currently in use.
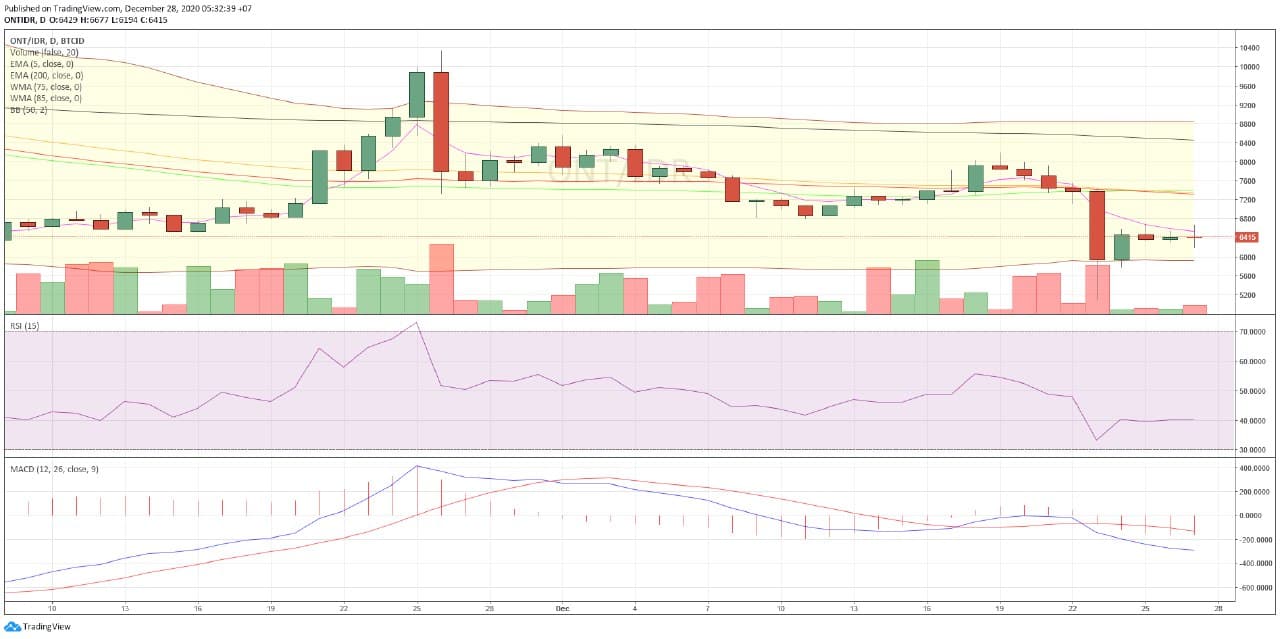
Chart ONT/IDR
In today’s trading, ONT moved at the lowest level at Rp6195 and the highest level at Rp6,677.
Here’s the ONT technical analysis for this week:
| action | ||
| EMA 5 | 6,534 | sell |
| WMA 75 | 7,317 | sell |
| WMA 85 | 7,311 | sell |
| EMA 200 | 8,460 | sell |
| RSI (15) | 40.0257 | neutral |
| MACD 12,26 | -294.0959 | sell |
| Summary | SELL (5) NEUTRAL(1) | |
| bearish |
- Ripple (XRP)
Ripple (XRP) experienced negative sentiment following the incidents of lawsuits from securities in the United States. Last week, the price suddenly dropped from IDR 8,000 to a low of IDR 3,500.
XRP’s downward trend is predicted to continue this week. This crypto asset has entered into 5 bearish crypto assets this week.
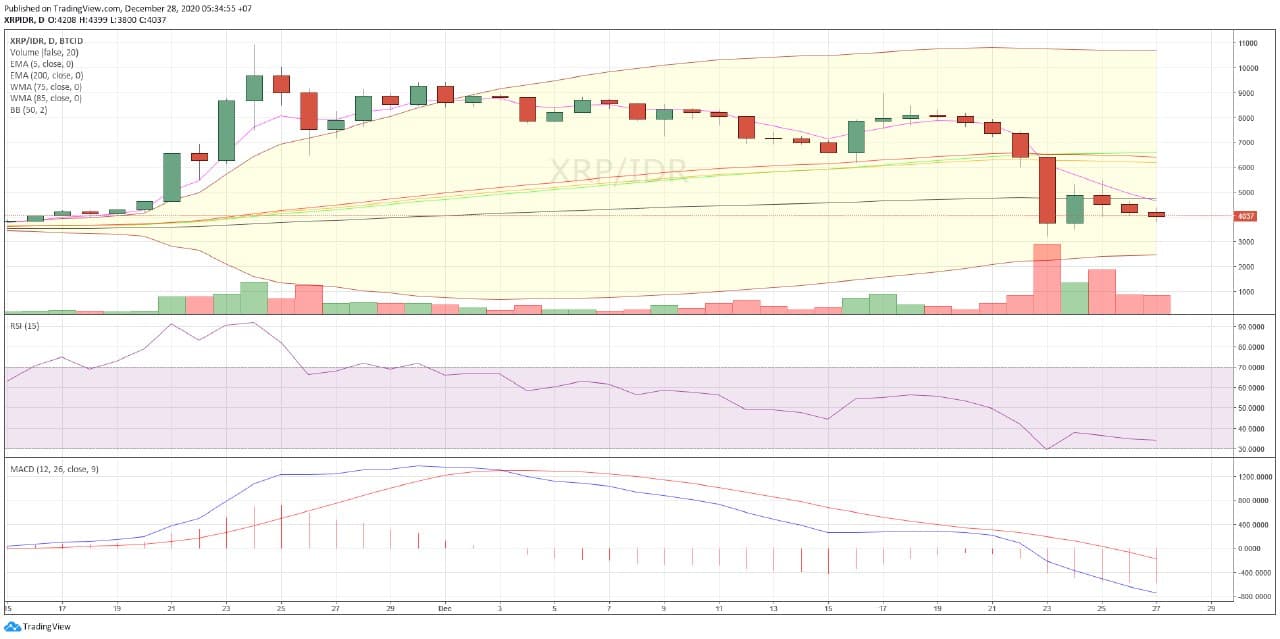
Chart XRP/IDR
In today’s trading, XRP moved at the lowest level of IDR 3,800 and the highest level of IDR 4,399.
Here’s the XRP technical analysis for this week:
| action | ||
| EMA 5 | 4,642 | sell |
| WMA 75 | 6,410 | sell |
| WMA 85 | 6,199 | sell |
| EMA 200 | 4,748 | sell |
| RSI (15) | 34.3137 | sell |
| MACD 12,26 | -743.8149 | sell |
| Summary | SELL | |
| bearish |
NOTE: If the EMA 5 crosses the WMA 75, 85 and 200 EMA and these lines intersect from bottom to top, the market trend tends to go up (bullish),
In each table above, it shows that if the value of EMA 5 is higher than WMA 75.85 and EMA 200 then the market tends to rise (bullish).
If the RSI and MACD values ??show the same condition, it means that the market is showing the same trend, overbought condition or oversold condition is an indicator that the market is at a point of changing the trend direction.
ATTENTION: All content which includes text, analysis, predictions, images in the form of graphics and charts, as well as news contained on this website, is only used as trading information only, and does not constitute a suggestion or suggestion to take an action in a transaction whether to buy or sell certain crypto assets. All crypto asset trading decisions are independent decisions by the user. Therefore, all risks arising from it, whether it is profit or loss, are not the responsibility of Indodax.


