
There are several crypto assets that will post fantastic performances over the next week. Indodax Market Signal this week, December 14 – December 20 predicts Bitcoin is still a bullish crypto asset.
So what about other crypto assets?
The upward trend or demand like Bitcoin and other crypto-assets occurs because many people want to secure their assets. Bitcoin and several crypto assets are considered capable of being an inflation hedge.
Especially at this time, many policies are considered to have an impact on the increase in the inflation rate. Meanwhile, other conventional investment products are deemed incapable of being an inflation hedge.
On the one hand, DeFi crypto assets are also predicted to experience an increase in prices this week. This is due to the high public interest in Ethereum (ETH) which ultimately also has an impact on the high interest of DeFi crypto assets. As a side note, many DeFi crypto assets do business under the Ethereum network.
5 Crypto Assets will be Bullish on This Week
- Bitcoin (BTC)
Bitcoin is one of the crypto assets that is bullish from December 14, 2020 to December 20, 2020. The king of these crypto assets is still in its highest price trend, in recent months.
BTC is also predicted to break record highs again in the near future.
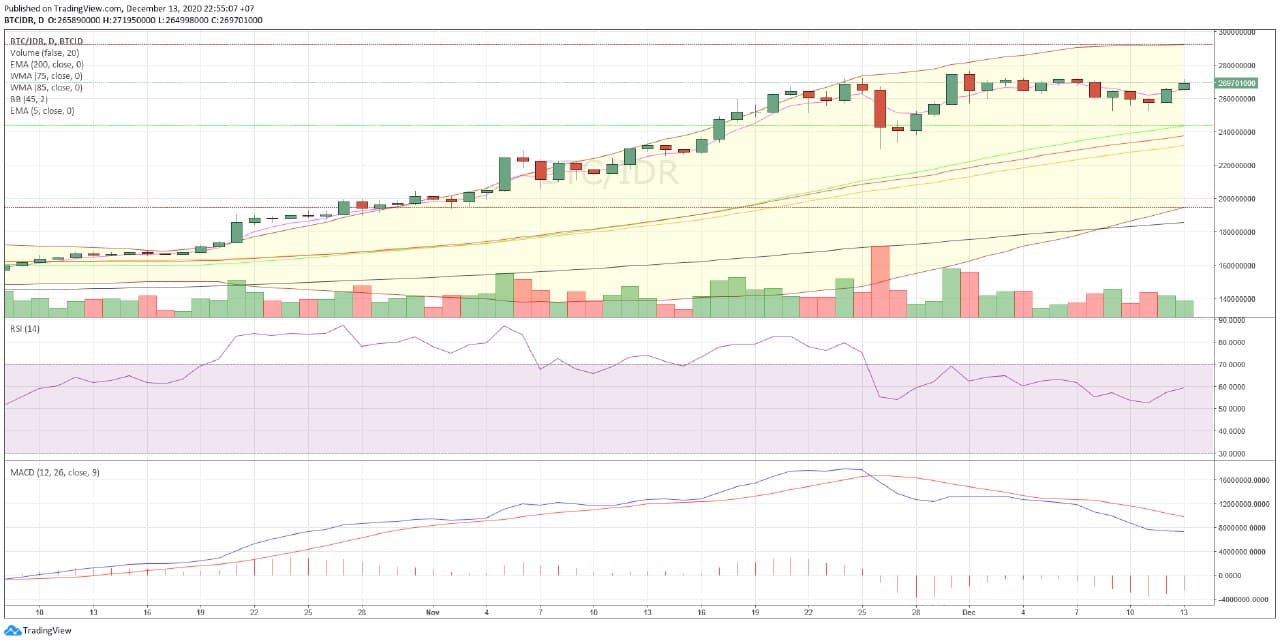
Chart Bitcoin/IDR
In today’s trading, BTC moved at the lowest level of IDR261,018,000 and the highest level was IDR271,950,000.
Here’s BTC’s technical analysis this week:
| Action | ||
| EMA 5 | 265,454,845 | buy |
| WMA 75 | 237,643,928 | buy |
| WMA 85 | 231,828,881 | buy |
| EMA 200 | 185,915,236 | buy |
| RSI (15) | 59.2956 | buy |
| MACD 12,26 | 7337871.451 | Buy |
| Summary | BUY | |
| Bullish |
In today’s trading, BTC moved at the lowest level of IDR261,018,000 and the highest level was IDR271,950,000.
Here’s BTC’s technical analysis this week:
- Ethereum (ETH)
Ethereum (ETH) has already started its evolution and upgraded to Ethereum 2.0. This causes ETH demand to increase.
This evolution will upgrade the old Ethereum network to a more effective Ethereum network. The increase in ETH prices also had an impact on increasing crypto assets based on Decentralized Finance (DeFi).
This is the reason why ETH is a bullish crypto asset this week.
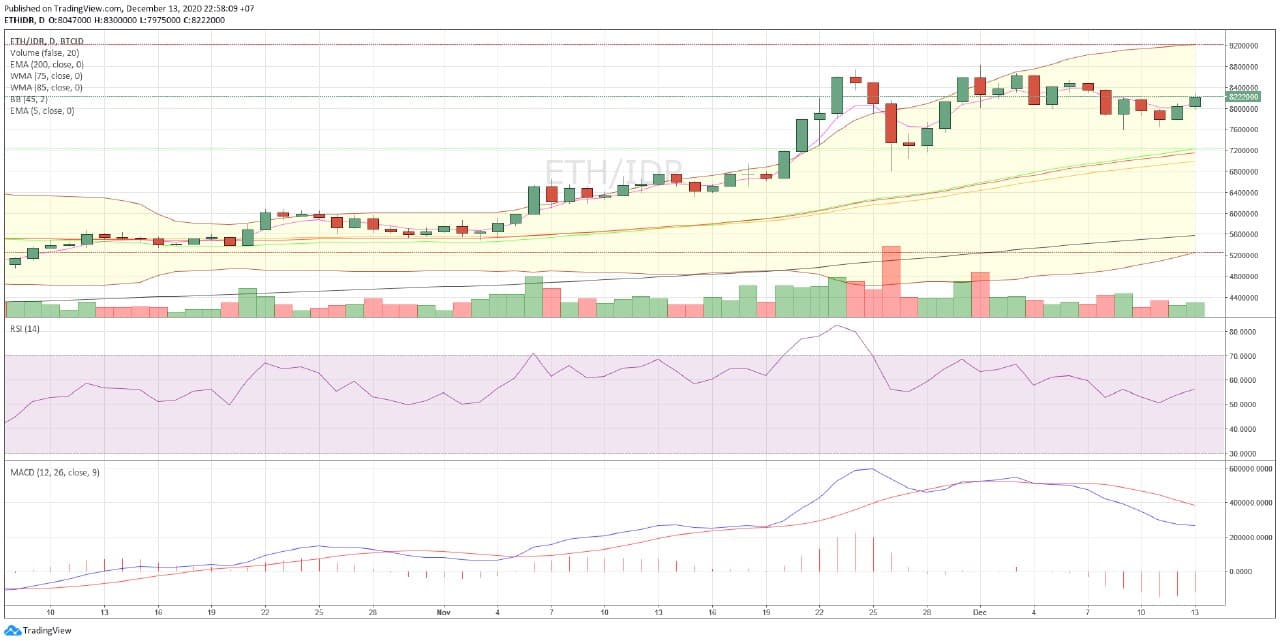
Chart ETH/IDR
In today’s trading, ETH moved at the lowest level of IDR7,850,000 and the highest level was IDR8,300,000. ETH entered into 5 bullish crypto assets this week.
Here’s the ETH technical analysis for this week:
| action | ||
| EMA 5 | 363,200,077 | buy |
| WMA 75 | 299,296,158 | buy |
| WMA 85 | 295,294,513 | buy |
| EMA 100 | 311,321,032 | buy |
| RSI (15) | 55.5851 | buy |
| MACD 12,26 | 17406080.76 | buy |
| Summary | buy | |
| bullish |
- yEarn Finance (YFI)
yEarn Finance is one of the DeFi-based crypto assets. This crypto asset made an innovation some time ago, in collaboration with Sushi Swap (SUSHI).
Last week, SUSHI was also the top crypto asset that was bullish this week.
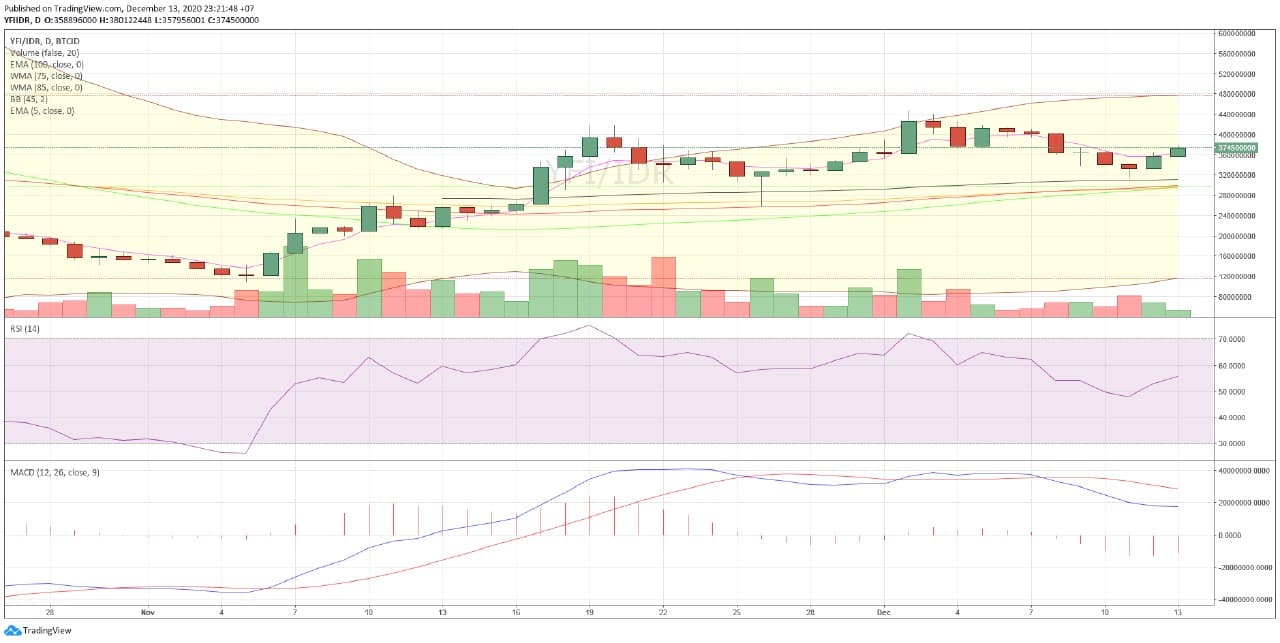
Chart YFI/IDR
In today’s trading, YFI moved at the lowest level of IDR348,421,052 and the highest level was IDR380,122,448. YFI has entered into 5 bullish crypto assets this week.
The following is YFI’s technical analysis for this week:
| action | ||
| EMA 5 | 363,200,077 | buy |
| WMA 75 | 299,296,158 | buy |
| WMA 85 | 295,294,513 | buy |
| EMA 100 | 311,321,032 | buy |
| RSI (15) | 55.5851 | buy |
| MACD 12,26 | 17406080.76 | buy |
| Summary | buy | |
| bullish |
- Chainlink (LINK)
The crypto asset that is bullish this week is Chainlink (LINK). Because it is DeFi based, LINK has also experienced price increases following ETH.
Chainlink is developing a secure blockchain middleware that intends to link smart contracts across the blockchain by allowing smart contracts to access resources outside of the main chain such as data feeds, web APIs, and traditional bank account payments.
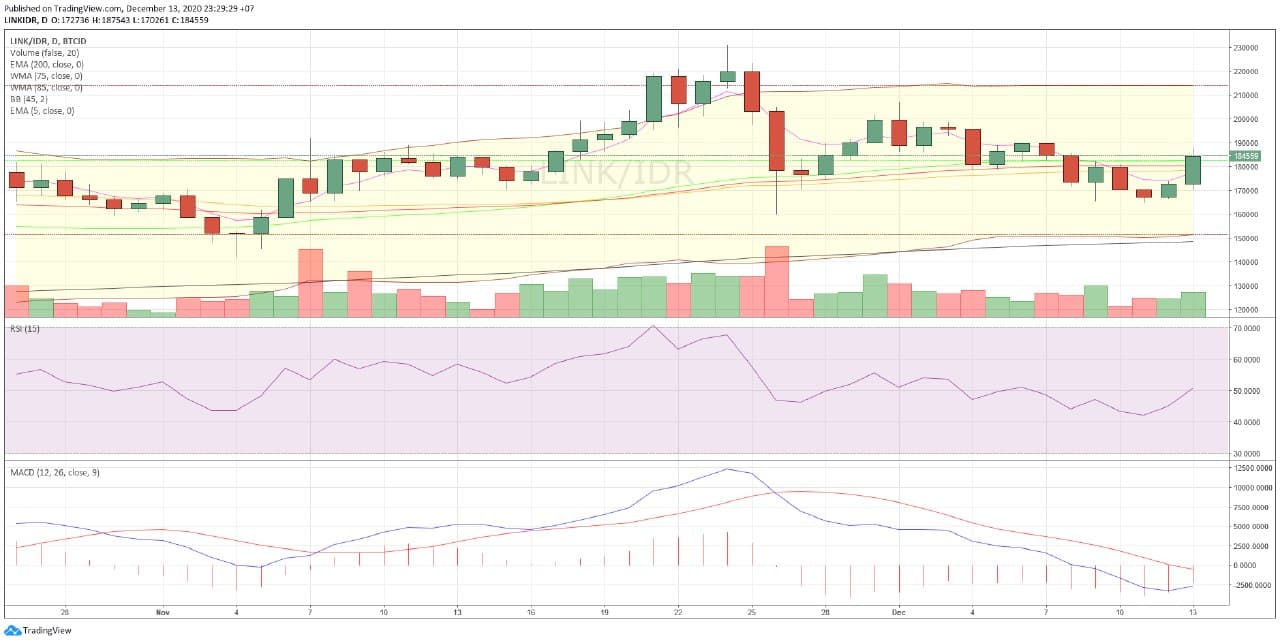
Chart LINK/IDR
In today’s trading, LINK moved at the lowest level at Rp169 and the highest level at Rp188. LINK entered into 5 bullish crypto assets this week.
The following is LINK’s technical analysis this week.
| action | ||
| EMA 5 | 177,711 | buy |
| WMA 75 | 180,608 | sell |
| WMA 85 | 178,380 | buy |
| EMA 200 | 148,403 | buy |
| RSI (15) | 51.4402 | buy |
| MACD 12,26 | -2661.2967 | oversold |
| Summary | BUY (4) SELL (1) OVERSOLD (1) |
- Aave (AAVE)
Aave describes itself as a decentralized, open-source, non-custodial financial market protocol. Depositors earn interest by providing liquidity to the lending pool, while borrowers obtain excess collateralized loans from this liquidity pool.
AAVE is also a coin or crypto asset that has an impact on the increase in ETH. AAVE is among the 5 crypto assets that are bullish this week.
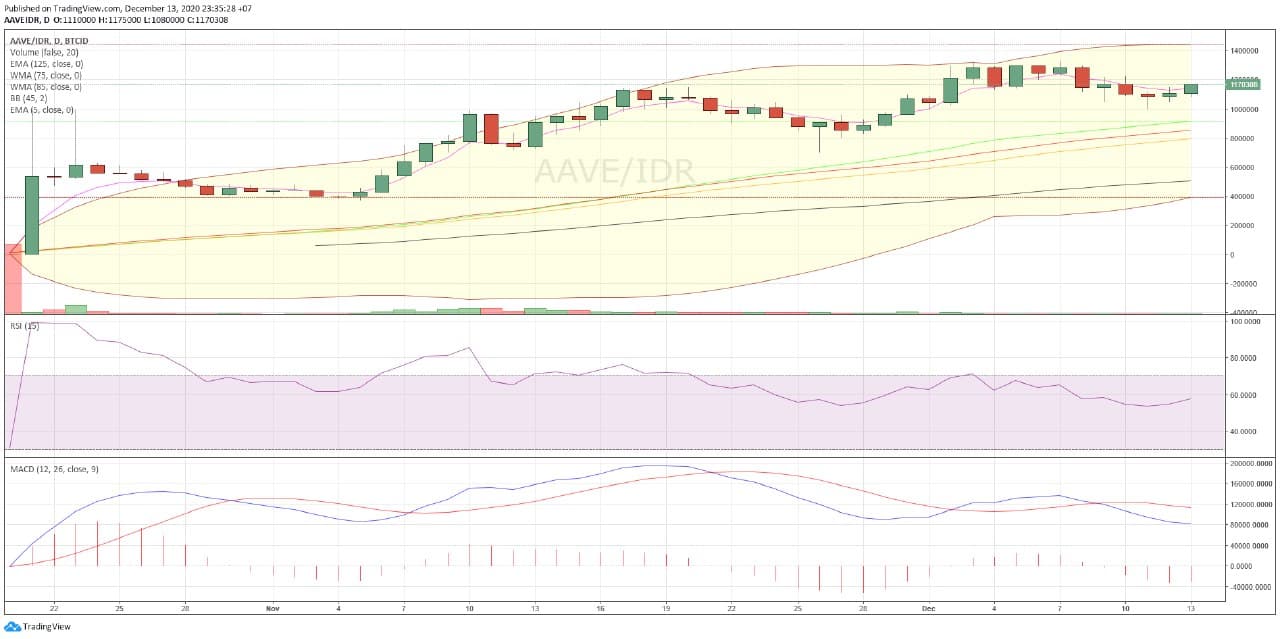
Chart AAVE/IDR
In today’s trading, AAVE is moving at the lowest level of IDR1,080,000 and the highest level is IDR1,175,000. AAVE entered into 5 bullish crypto assets this week.
Here’s AAVE’s technical analysis for this week:
| action | ||
| EMA 5 | 1,143,279 | buy |
| WMA 75 | 856,059 | buy |
| WMA 85 | 793,701 | buy |
| EMA 125 | 497,168 | buy |
| RSI (15) | 54.7686 | buy |
| MACD 12,26 | 81969.2986 | buy |
| Summary | BUY | |
| bullish |
5 Crypto Asset will be Bearish on This Week
- XinFin Network (XDC)
One of the crypto assets that was bearish this week is XDC. XinFin Network is still unable to innovate, so traders tend to be left out. This causes the price for the next week to decline.
eXchange inFinite (XinFin), is a delegated proof of stake consensus (XDPoS) network, which enables Hybrid Relay Bridges, Instant Block Finality and interoperability with ISO20022 messaging standards, making XinFin’s Hybrid Architecture Developer friendly. XinFin Digital Contract (XDC) is a digital asset that supports the XinFin network.
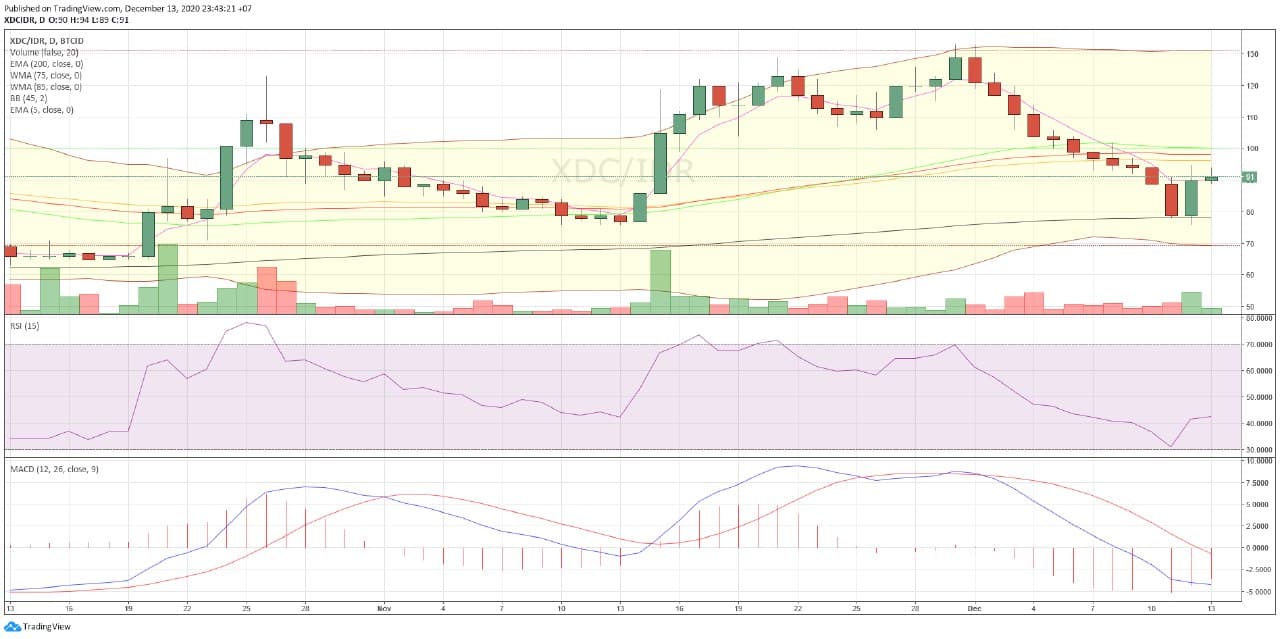
Chart XDC/IDR
In mid-year trading, XDC moved at the lowest level of IDR 89 and the highest level of IDR 95.
Here’s the XDC technical analysis for this week:
| action | ||
| EMA 5 | 90 | sell |
| WMA 75 | 98 | sell |
| WMA 85 | 96 | sell |
| EMA 200 | 78 | buy |
| RSI (15) | 42.5633 | buy |
| MACD 12,26 | -4.2253 | oversold |
| Summary | SELL (3) BUY (2) OVERSOLD (1) | |
| bearish |
- Multi-collateral Dai (DAI)
Multi-collrateral Dai (DAI) is the next bearish crypto asset. This is because this crypto asset has decreased in demand.
DAI Stablecoin is a crypto asset backed by collateral whose value is relatively stable against the United States Dollar (US). Believe that a stable digital asset such as DAI Stablecoin is essential to realize the full potential of blockchain technology, and Total Supply of 442,619,535 DAI.
Unfortunately, the US Dollar is still experiencing price depreciation after the US Presidential Election and policies in the recovery of COVID-19. This is the reason why DAI is among the 5 crypto assets that are bearish this week.
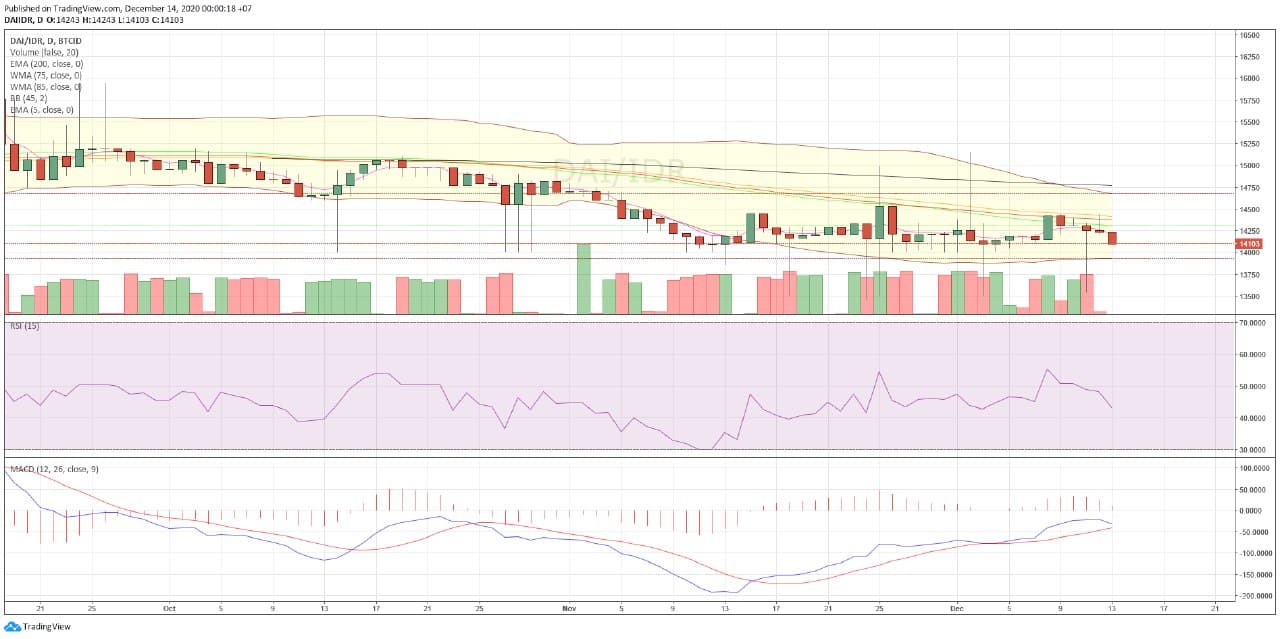
Chart DAI/IDR
In today’s trading, DAI moved at the lowest level of Rp1901 and the highest level was Rp1945
The following is DAI’s technical analysis for this week:
| Action | ||
| EMA 5 | 1,928 | sell |
| WMA 75 | 1,840 | sell |
| WMA 85 | 1,945 | sell |
| EMA 200 | 2,030 | sell |
| RSI (15) | 51.5924 | sell |
| MACD 12,26 | -4.6076 | oversold |
| Summary | SELL (5) Oversold (1) | |
| Bearish |
- CELO
CELO is less desirable. People are more likely to buy other crypto assets and these crypto assets are abandoned.
So that this crypto asset is included in the 5 crypto assets that have been bearish this week. During 14 December-21 December 2020.
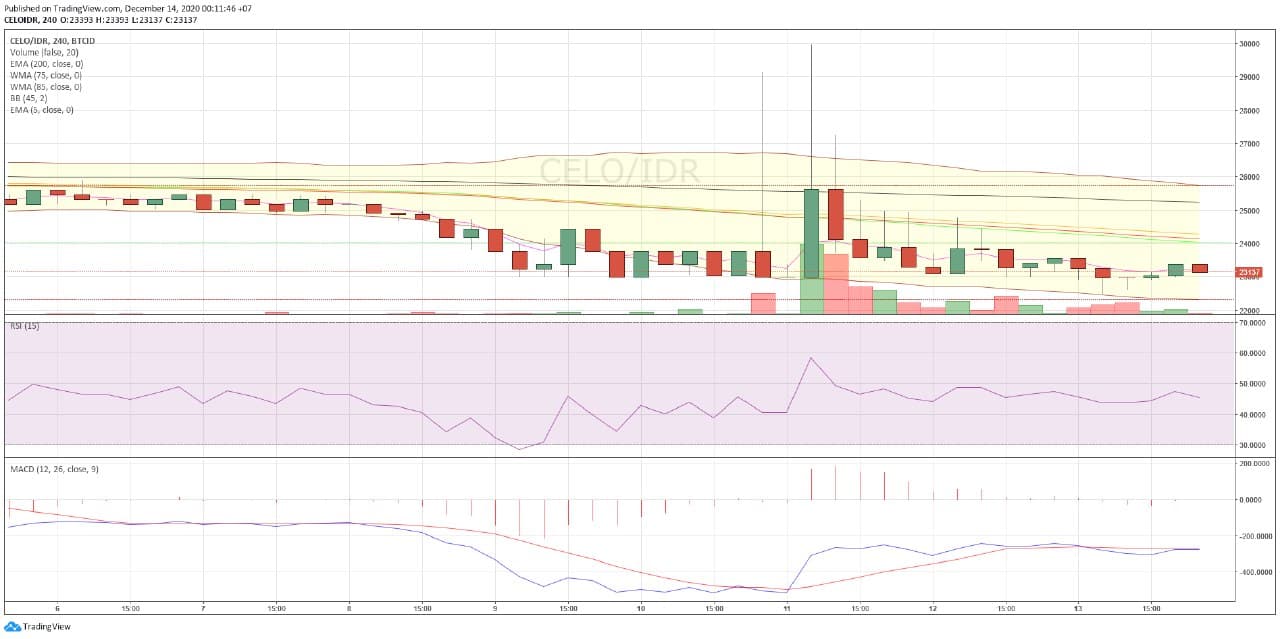
Chart CELO/IDR
In today’s trading, the lowest price of CELO is at the level of Rp22,502 and the highest price is Rp23,659.
Here’s CELO’s technical analysis for this week:
| action | ||
| EMA 5 | 23,970 | sell |
| WMA 75 | 25,324 | sell |
| WMA 85 | 25,358 | sell |
| EMA 200 | 25,796 | sell |
| RSI (15) | 28.3673 | neutral |
| MACD 12,26 | -423.2421 | oversold |
| Summary | SELL (4) NEUTRAL (1) Oversold (1) | |
| bearish |
- Crypto.com (CRO)
Crypto.com is still showing price weakness over the past 3 weeks. In fact, crypto assets are one of the most popular crypto assets.
It’s just that Crypto.com hasn’t been able to innovate to retain its investors. Thus, causing the price to decline, just like the previous weeks. So that CRO entered into 5 bearish crypto assets this week.
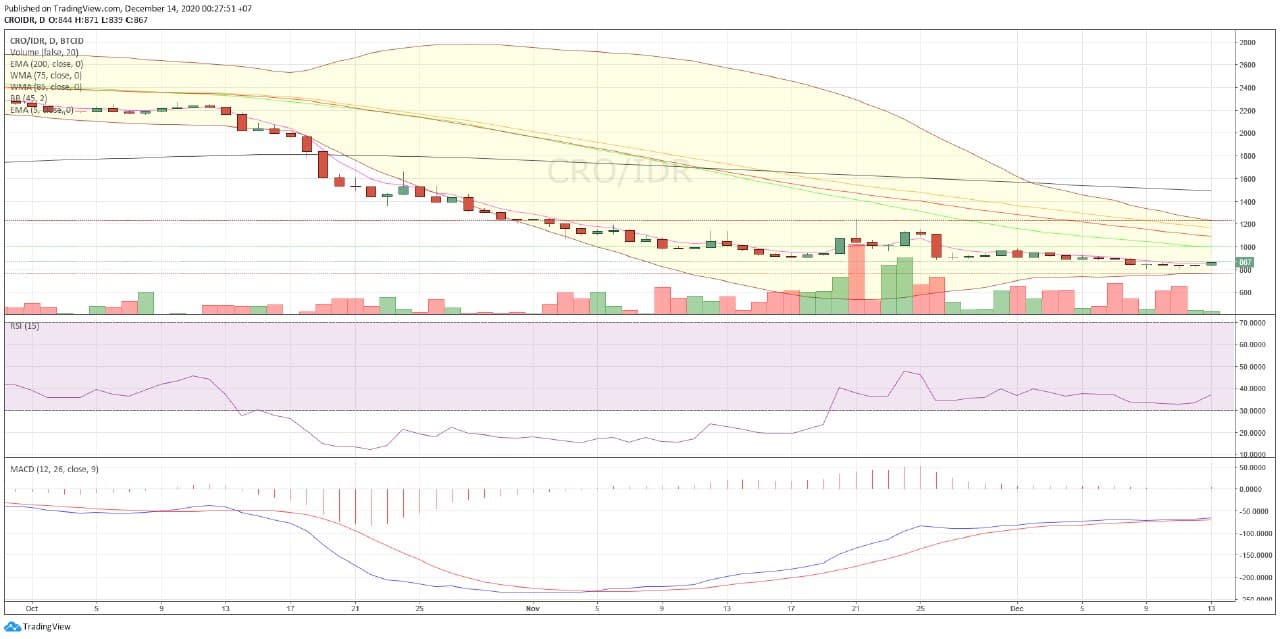
Chart CRO/IDR
In today’s trading, CRO moved at the lowest level at IDR823 and the highest level at IDR871.
Here’s the CRO technical analysis for this week:
| action | ||
| EMA 5 | 858 | sell |
| WMA 75 | 2,158 | sell |
| WMA 85 | 2,188 | sell |
| EMA 200 | 1,796 | sell |
| RSI (15) | 21.4544 | buy |
| MACD 12,26 | -208.2614 | oversold |
| Summary | SELL (4) BUY (1) OVERSOLD(1) | |
| bearish |
- Tether (USDT)
Tether (USDT) continues to decline. In the last few weeks, USDT is still showing a decline in prices. This is because the United States Dollar (US) is weakening.
This is because the US economy has yet to show any recovery after the presidential election, last November. USDT is a stable coin that embraces the price of US Dollar.
This crypto asset has entered into 5 bearish crypto assets this week.
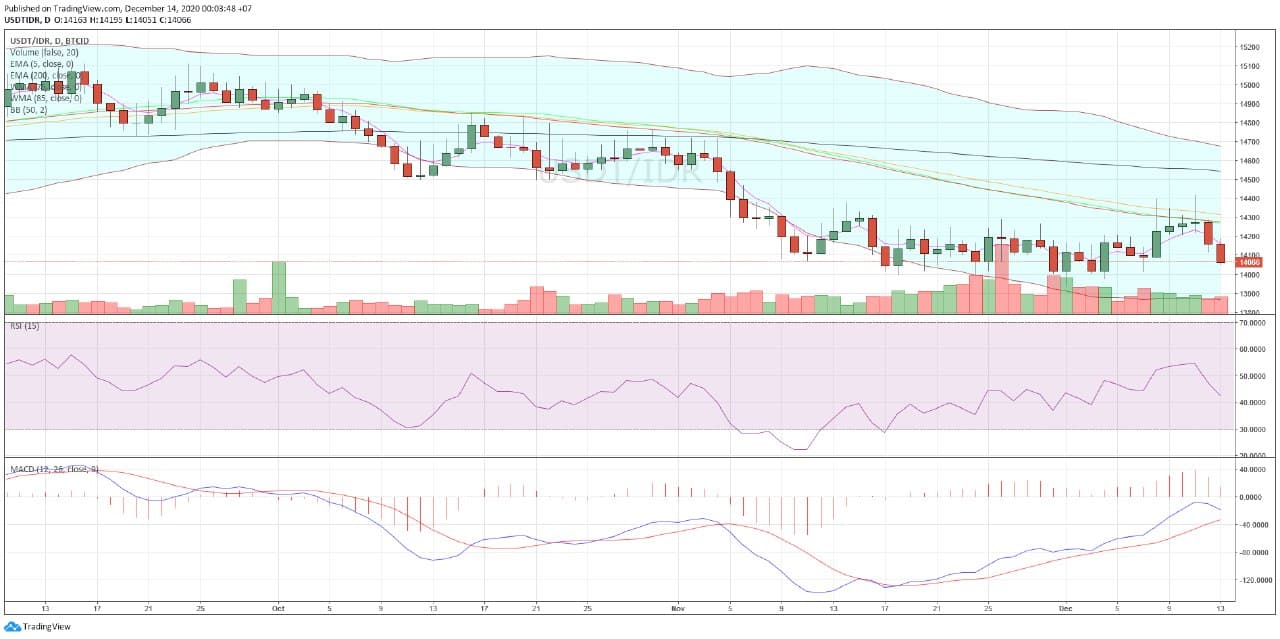
Chart USDT/IDR
In today’s trading, USDT moved at the lowest level of IDR14,051 and the highest level was IDR14,209.
Here’s the USDT technical analysis for this week:
| action | ||
| EMA 5 | 14,162 | sell |
| WMA 75 | 14,275 | sell |
| WMA 85 | 14,314 | sell |
| EMA 200 | 14,544 | sell |
| RSI (15) | 42.6578 | sell |
| MACD 12,26 | -18.4345 | sell |
| Summary | SELL (6) | |
| bearish |
NOTE: If the EMA 5 crosses the WMA 75, 85 and 200 EMA and these lines intersect from bottom to top, the market trend tends to go up (bullish),
In each table above, it shows that if the value of EMA 5 is higher than WMA 75.85 and EMA 200 then the market tends to rise (bullish).
If the RSI and MACD values ??show the same condition, it means that the market is showing the same trend, overbought conditions or oversold conditions are an indicator that the market is at a point of changing the trend direction.
ATTENTION: All content which includes text, analysis, predictions, images in the form of graphics and charts, as well as news contained on this website, is only used as trading information only, and does not constitute a suggestion or suggestion to take an action in a transaction whether to buy or sell certain crypto assets. All crypto asset trading decisions are independent decisions by the user. Therefore, all risks arising from it, whether it is profit or loss, are not the responsibility of Indodax.


