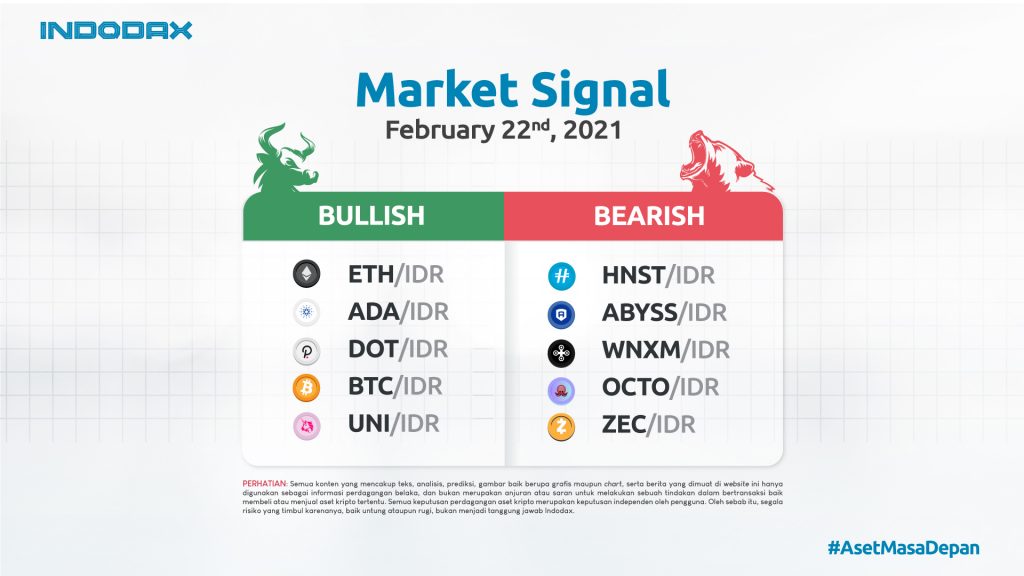
Indodax market signal February 22, 2021, this time re-publishing bullish and bearish crypto assets for the next week. Bitcoin recorded the highest price. How about other crypto assets?
Bitcoin again recorded a record high last week. Initially, Bitcoin climbed to a record high of up to IDR 750 million. Furthermore, tread to a higher peak of Rp 851 million.
In general, almost all crypto assets have increased. However, only 5 crypto assets were reviewed.
However, so far, crypto assets that are predicted to experience price increases are almost the same as the market signals in the previous edition.
Apart from that, although there were only a few crypto assets that experienced a decline last week. However, you have to be careful, it’s possible that crypto assets will decline at any time. In this article, we will also discuss 5 crypto assets that are predicted to decline in price.
Here are 5 bullish and bearish crypto assets on the Indodax market this week.
5 Bullish Crypto Assets This Week
- Ethereum (ETH)
Ethereum is one of the crypto assets that will experience a price increase or bullish this week. Ethereum has also climbed its highest price past Rp.29 million.
This increase is predicted to continue. Although every now and then, there will be times when Ethereum will experience a price drop.
Apart from Bitcoin, Ethereum is also expected to experience an increase in price during this one year. Because ETH is being upgraded to ETH 2.0. During this upgrade period, ETH will reduce supply and will experience a surge in demand.
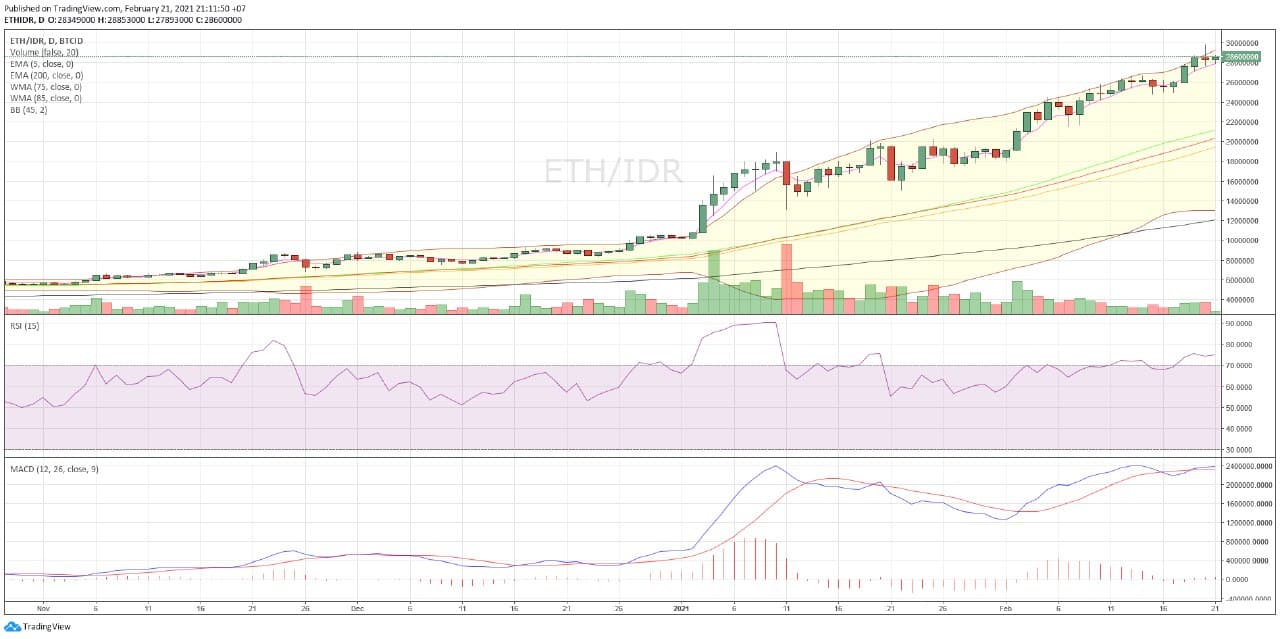
Chart ETH/IDR
In today’s trading, ETH moved at the lowest level of IDR 27,650,000 and the highest was IDR 29,300,000.
Here’s the ETH technical analysis for this week:
| action | ||
| EMA 5 | 26,417,991 | buy |
| WMA 75 | 19,355,856 | buy |
| WMA 85 | 18,488,832 | buy |
| EMA 200 | 11,395,200 | buy |
| RSI (15) | 734781 | buy |
| MACD 12,26 | 2245073 | buy |
| Summary | BUY | |
| bullish |
- Cardano (ADA)
The next up or bullish crypto asset is Cardano (ADA). This crypto asset saw fantastic price increases during 2020.
Furthermore, at the beginning of this year, ADA also continued its upward trend in prices. It is predicted that the ADA price will also be bullish on an annual basis. Although there are times when prices will decline because the market is saturated.
Cardano or ADA is a crypto network and open source project created to operate a public blockchain platform for smart contracts or smart contracts.
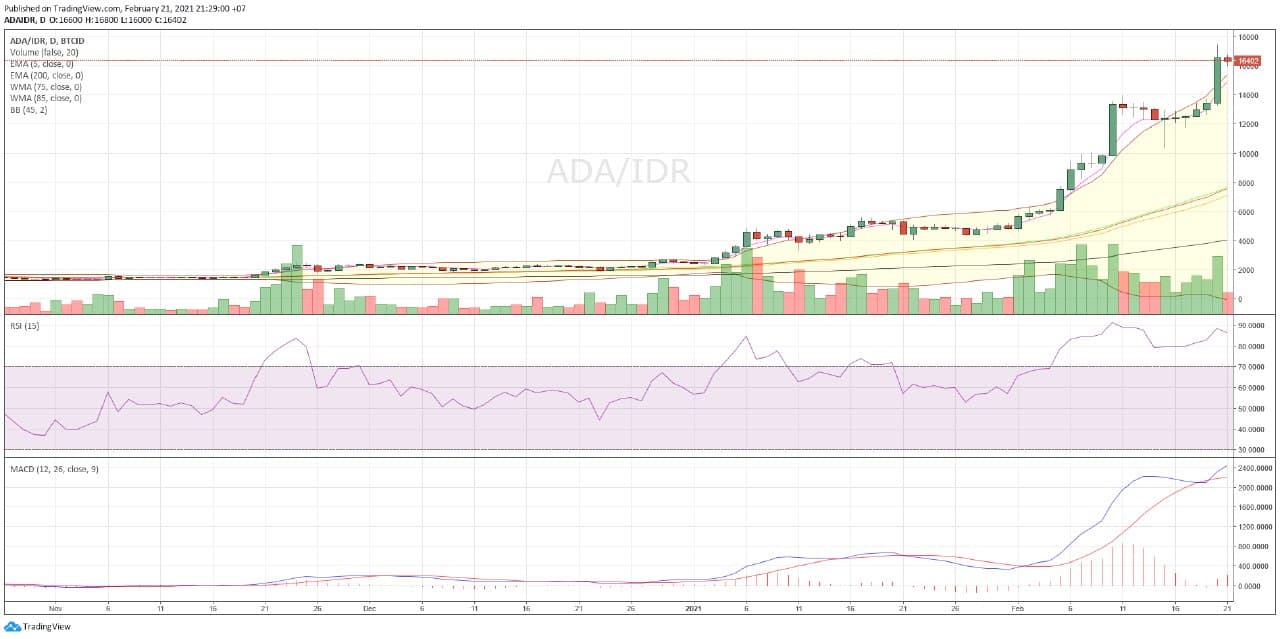
Chart ADA/IDR
In today’s trading, ADA moved at the lowest level of Rp15,000 and the highest level was Rp17,500. ADA has entered into 5 bullish crypto assets on Indodax Market Signal this week.
Here’s the ADA technical analysis for this week:
| action | ||
| EMA 5 | 12,670 | buy |
| WMA 75 | 6,757 | buy |
| WMA 85 | 6,343 | buy |
| EMA 200 | 3,702 | buy |
| RSI (15) | 81.4263 | overbought |
| MACD 12,26 | 2098.4816 | buy |
| Summary | BUY (5) overbought (1) | |
| bullish |
- Polkadot (DOT
The next crypto asset to experience price increases is Polkadot (DOT). This crypto asset has also seen a price increase in the last week. This week, the DOT is predicted to continue.
Just like previous crypto assets, DOT has also experienced a fantastic price increase in the last year. Furthermore, this crypto asset experienced an increase in price at the beginning of this year.
Analysts predict that the DOT is also believed to experience a fantastic price spike in 2021.
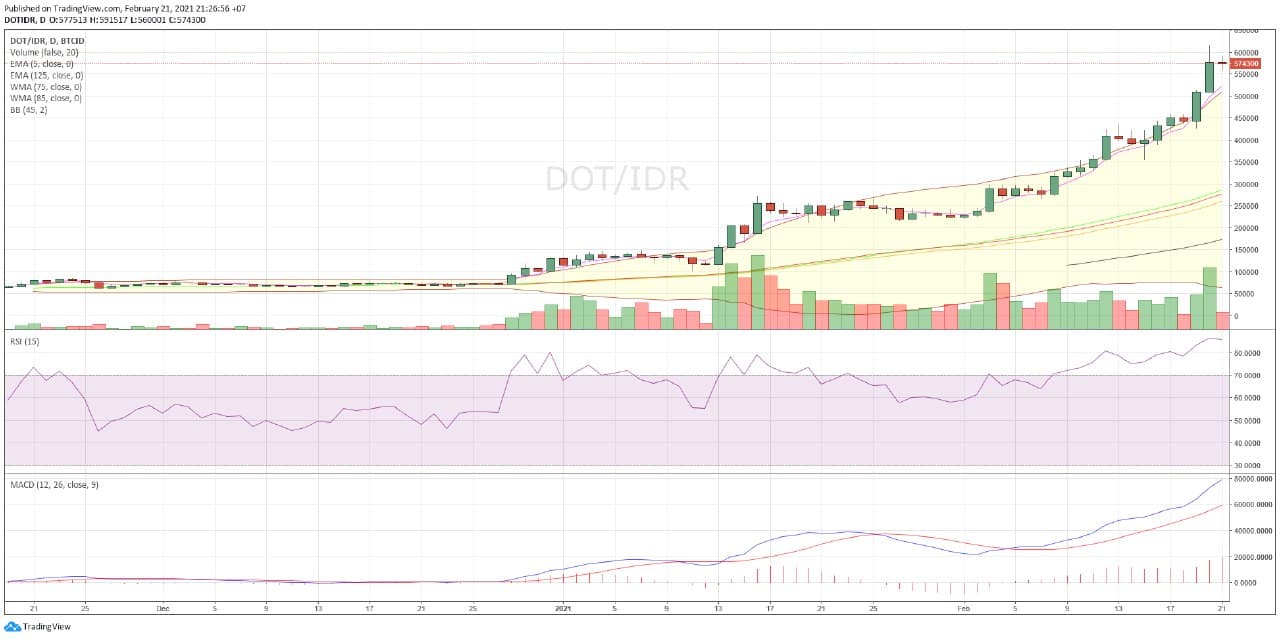
Chart DOT/IDR
In today’s trading, DOT moved at the lowest level of IDR 555,000 and the highest level of IDR 615,995. DOT has entered into 5 bullish crypto assets this week.
Here’s the DOT technical analysis for this week:
| action | ||
| EMA 5 | 454,639 | buy |
| WMA 75 | 256,895 | buy |
| WMA 85 | 241,290 | buy |
| EMA 125 | 159,531 | buy |
| RSI (15) | 83.2578 | overbought |
| MACD 12,26 | 63640.7002 | buy |
| Summary | buy (5) overbought (1) | |
| bullish |
- Bitcoin (BTC)
The crypto asset that has the next price increase or bullishness is Bitcoin. “The King” of this crypto asset will still experience price increases next week.
However, you need to be careful, the decline in Bitcoin can happen at any time. Although, it is believed, Bitcoin will not experience a fantastic price drop.
Bitcoin is still flooded with demand or demand. This trend occurs because the price of Bitcoin continues to rise. There has been a tendency for people to trust Bitcoin more since its fantastic increase in price.
In addition, the positive news about Bitcoin also increases people’s confidence in buying Bitcoin.
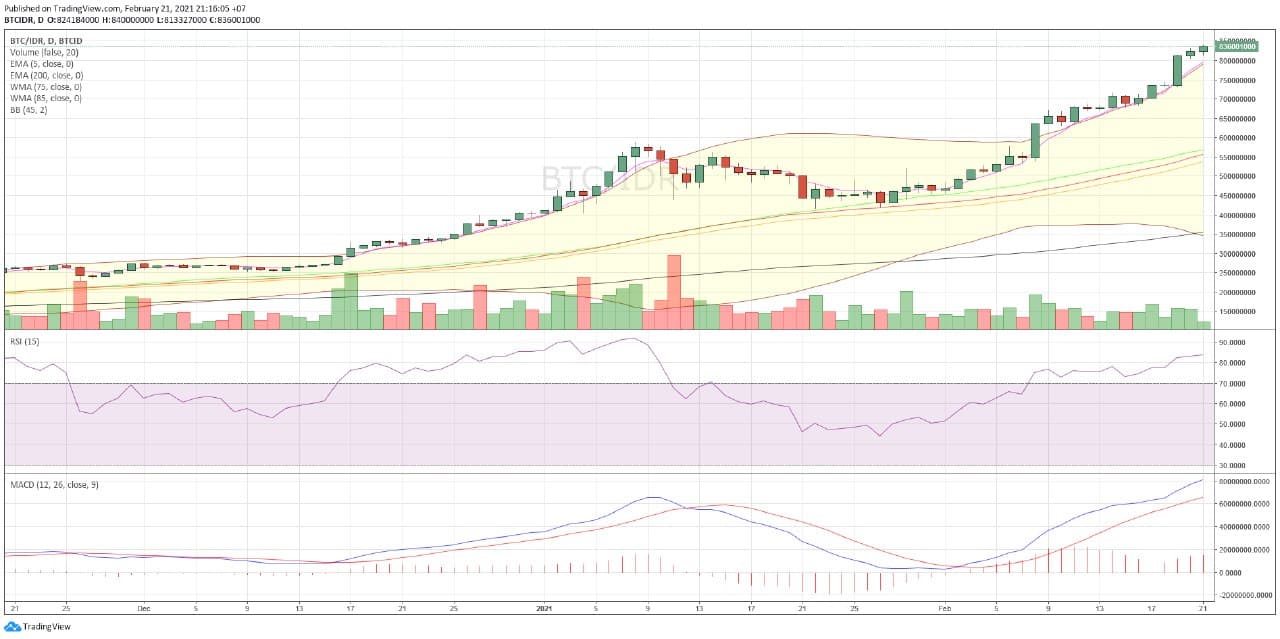
Chart BTC/IDR
In today’s trading, BTC moved at the lowest level of IDR 807,000,000 and the highest level was IDR 840,000,000. BTC entered into 5 bullish crypto assets this week.
Here’s BTC’s technical analysis this week.
| action | ||
| EMA 5 | 704,761,405 | buy |
| WMA 75 | 521,697,184 | buy |
| WMA 85 | 504,345,997 | buy |
| EMA 200 | 336,784,213 | buy |
| RSI (15) | 77.2208 | buy |
| MACD 12,26 | 63401595 | buy |
| Summary | BUY | |
| bullish |
- Uniswap (UNI)
Uniswap (UNI) is the next crypto asset that will experience a price increase or bullish. Uniswap is one of the most popular decentralized finance (DeFi) crypto assets.
Uniswap is a DeFi platform where people can stake or pledge a crypto asset. Then, the stakers get a loan in the form of another crypto asset.
Uniswap continues the upward trend in prices in line with the upward trend of other crypto assets.
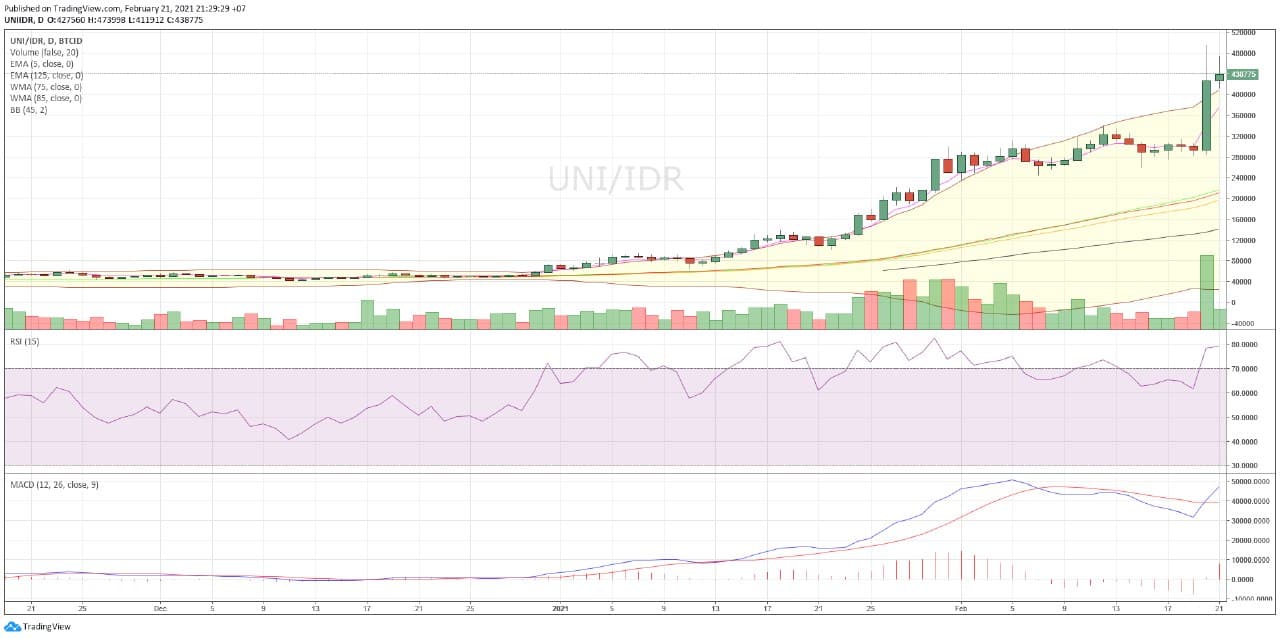
Chart UNI/IDR
In today’s trade, UNI moved at the lowest level at IDR 386,122 and the highest level at IDR 494,988. UNI has entered into 5 bullish crypto assets this week.
The following is the UNI technical analysis for this week:
| action | ||
| EMA 5 | 341,177 | buy |
| WMA 75 | 202,495 | buy |
| WMA 85 | 188,965 | buy |
| EMA 200 | 98,171 | buy |
| RSI (15) | 78.4115 | buy |
| MACD 12,26 | 40049.7796 | buy |
| Summary | BUY | |
| bullish |
Here Are 5 Bearish Crypto Assets This Week
- Honest Mining (HNST)
The crypto asset to experience the first decline or bearishness is Honest Mining (HNST). This domestic crypto asset is a crypto asset that will experience a decline over the next week.
HNST is a domestic crypto asset. After rising drastically, this week, HNST resumed its decline or resistance. Analysis shows HNST is also predicted to experience oversold or massive sales.
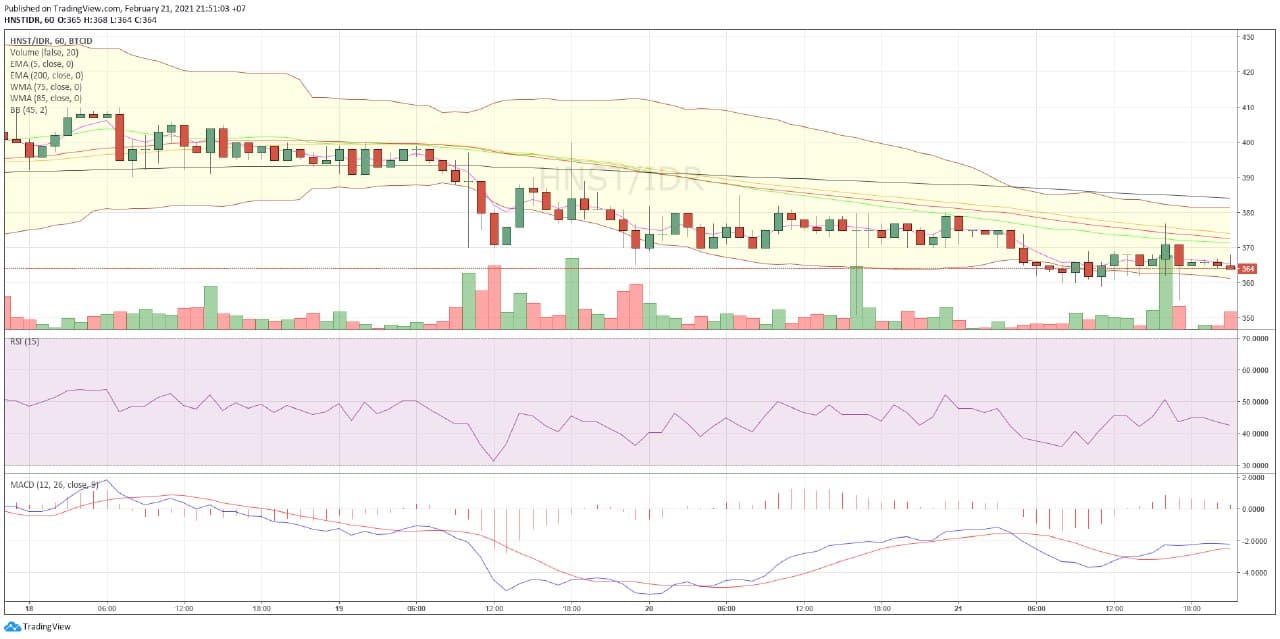
Chart HNST/IDR
In mid-year trading, HNST moved at the lowest level of IDR 355 and the highest level of IDR 380.
The following is the HNST technical analysis for this week:
| action | ||
| EMA 5 | 365 | sell |
| WMA 75 | 372 | sell |
| WMA 85 | 374 | sell |
| EMA 200 | 384 | sell |
| RSI (15) | 43.751 | sell |
| MACD 12,26 | -2.1571 | oversold |
| Summary | SELL (5) OVERSOLD (1) | |
| bearish |
- ABYSS
The next drop in or bearish crypto asset is ABYSS. This crypto asset had touched the highest increase last week. However, towards the end of the week, ABYSS actually reversed course.
ABYSS functions as a native digital currency (platform only) used for shopping, in-game purchases, gifts and payments on The Abyss platform. The Abyss token is issued on the Ethereum network and complies with the ERC20 standard.
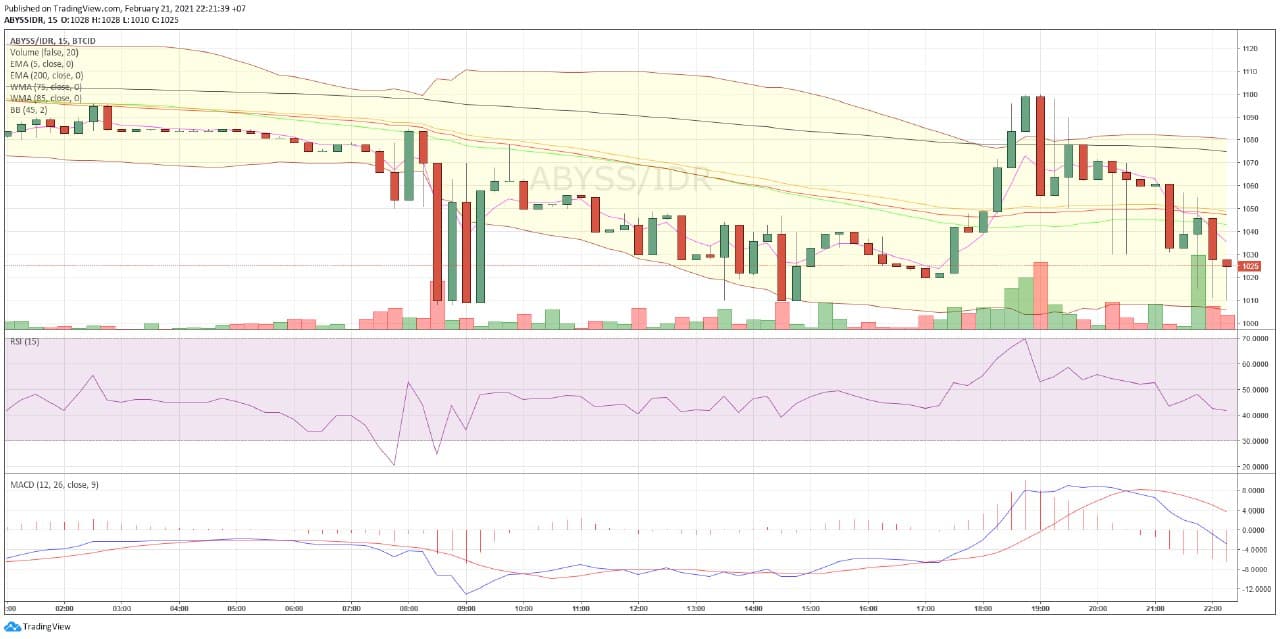
Chart ABYSS/IDR
In today’s trading, ABYSS is moving at the lowest level of IDR1008 and the highest level of IDR1,100
Here’s the ABYSS technical analysis for this week:
| action | ||
| EMA 5 | 1,034 | sell |
| WMA 75 | 1,047 | sell |
| WMA 85 | 1,048 | sell |
| EMA 200 | 1,074 | sell |
| RSI (15) | 40.4935 | sell |
| MACD 12,26 | -3.1844 | sell |
| Summary | SELL | |
| bearish |
- Wrapped Nexus Mutual (WNXM)
The next dropping or bearish crypto asset is Wrapped Nexus Mutual (WNXM). Investors should abandon this DeFi crypto asset because there is no innovation yet. So that it is predicted to show a decline in prices.
WNXM is a token created on the ERC20 network created by Ethereum. WNXM adds or represents NXM to remain tradable outside of the NXM (Nexus Mutual) platform.
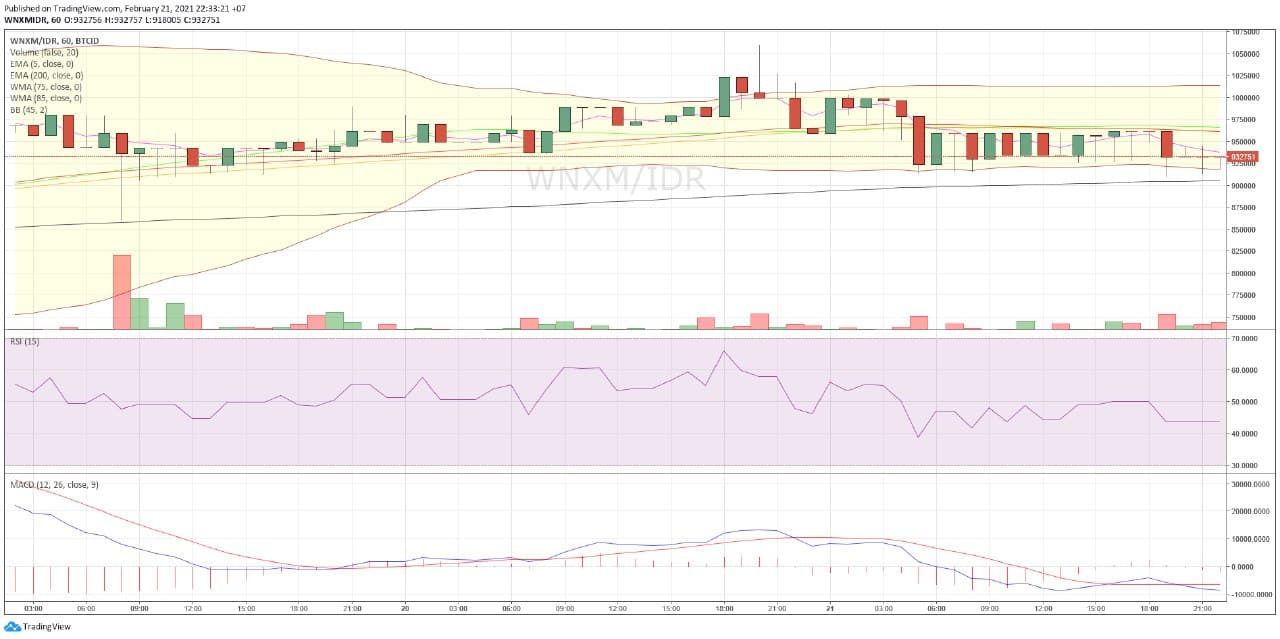
Chart WNXM/IDR
In today’s trading, the lowest price of WNXM was at the level of Rp910,112 and the highest price was Rp1,000,042.
Here’s the WNXM technical analysis for this week:
| action | ||
| EMA 5 | 940,402 | sell |
| WMA 75 | 961,918 | sell |
| WMA 85 | 962,314 | sell |
| EMA 200 | 904,941 | buy |
| RSI (15) | 43.6017 | sell |
| MACD 12,26 | -8008.9077 | sell |
| Summary | SELL (5) BUY (1) | |
| bearish |
- OCTO
The following crypto assets that have decreased or are bearish are OCTO. This DeFi crypto asset has fallen in price.
Although at the beginning of the year OCTO had increased dramatically, it seems that this week will experience a price decline.
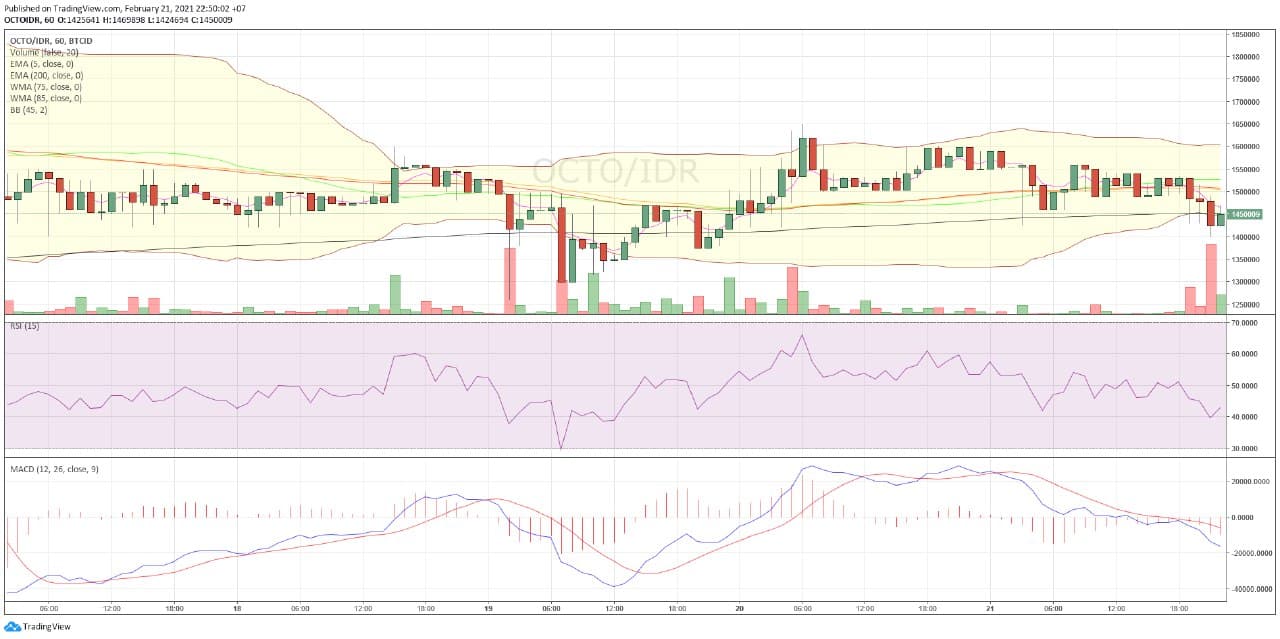
Chart OCTO/IDR
In today’s trading, OCTO moved at the lowest level at IDR 1,399,998 and the highest level at IDR 1,599,000.
Here’s the OCTO technical analysis for this week:
| action | ||
| EMA 5 | 1,498,669 | sell |
| WMA 75 | 1,510,396 | sell |
| WMA 85 | 1,507,210 | sell |
| EMA 200 | 1,451,518 | buy |
| RSI (15) | 42.5582 | buy |
| MACD 12,26 | -13645.3711 | sell |
| Summary | SELL (4) BUY (2) | |
| bearish |
- Zcash (ZEC)
Finally, ZCash (ZEC) is a crypto asset that is experiencing a price decline or is bearish. The decline occurred because ZCash was abandoned by investors. This crypto asset has not been able to attract investors’ attention with technological developments.
ZEC stands for Zerocoin Electricity Coin. This crypto asset was launched in 2016 by a team of engineers, cryptographers, activists, educators and policy workers and supports the development of the Zcash cryptocurrency.
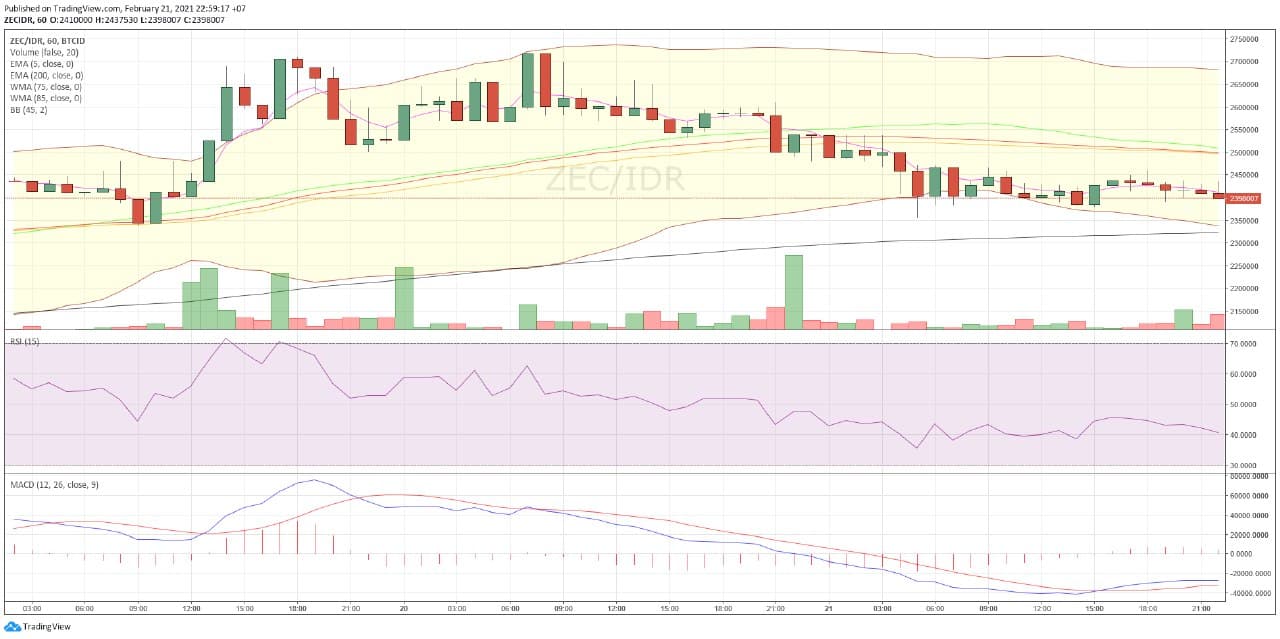
Chart ZEC/IDR
In today’s trading, ZEC moved at the lowest level of Rp2,355,000 and the highest level was Rp2,690,000.
Here’s the ZEC technical analysis this week:
| action | ||
| EMA 5 | 2,418,050 | sell |
| WMA 75 | 2,500,460 | sell |
| WMA 85 | 2,498,805 | sell |
| EMA 200 | 2,322,335 | buy |
| RSI (15) | 42.2603 | sell |
| MACD 12,26 | -27109.7274 | oversold |
| Summary | SELL (4) buy (1) oversold (1) | |
| bearish |
NOTE: If the EMA 5 crosses the WMA 75, 85 and 200 EMA and these lines intersect from bottom to top, the market trend tends to go up (bullish),
In each table above, it shows that if the value of EMA 5 is higher than WMA 75.85 and EMA 200 then the market tends to rise (bullish).
If the RSI and MACD values ??show the same condition, it means that the market is showing the same trend, overbought condition or oversold condition is an indicator that the market is at a point of changing the trend direction.
ATTENTION: All content which includes text, analysis, predictions, images in the form of graphics and charts, as well as news contained on this website, is only used as trading information only, and does not constitute a suggestion or suggestion to take an action in a transaction whether to buy or sell certain crypto assets. All crypto asset trading decisions are independent decisions by the user. Therefore, all risks arising from it, whether it is profit or loss, are not the responsibility of Indodax.


