
This week’s bullish and bearish crypto assets are not likely to be that different from before. The two coins with the largest market caps, Bitcoin and Ethereum, are still continuing their upward trend in prices earlier this year.
In the last week, Bitcoin and Ethereum were a bit saturated. BTC had dropped to around Rp. 400 million. Meanwhile, ETH fell to around IDR 14 million.
The decline occurred because the market was getting saturated. Naturally, BTC has been experiencing a bullish trend since November 2020. Likewise with ETH.
However, overall, the bullish Bitcoin trend was still happening last week. Bitcoin had touched the level of Rp.560 million.
This also affects other crypto assets that are also trending bullish. It is very reasonable because, in technology and crypto asset transactions, BTC usually affects other prices.
Meanwhile, the bearish trend also persists in US Dollar stablecoins. Tether (USDT) and USD Coin (USDC) are also predicted to decline. Even this USD stablecoin has been experiencing its lowest point in the last few months.
Here are 5 crypto assets that are bullish and bearish on January 18, 2021-25 January 2021 on the Indodax market.
5 Crypto Assets will Bullish on This Week
- Bitcoin (BTC)
2021 is a bullish year for Bitcoin. The increase in the price of Bitcoin this year has occurred since the beginning of this year. This increase occurred due to increased demand and limited supply.
Demand is increasing as people’s understanding of Bitcoin’s utility and fundamentals continues to increase. Coupled with the trend of rising prices which also attracted attention.
Meanwhile, the supply or supply of Bitcoin will be less and more difficult to mine. Bitcoin reserves are only around 2.5 million BTC left. Meanwhile, miners have also started to struggle due to the Halving Day factor.
This week, after experiencing a slight decline last week, BTC is predicted to be bullish.
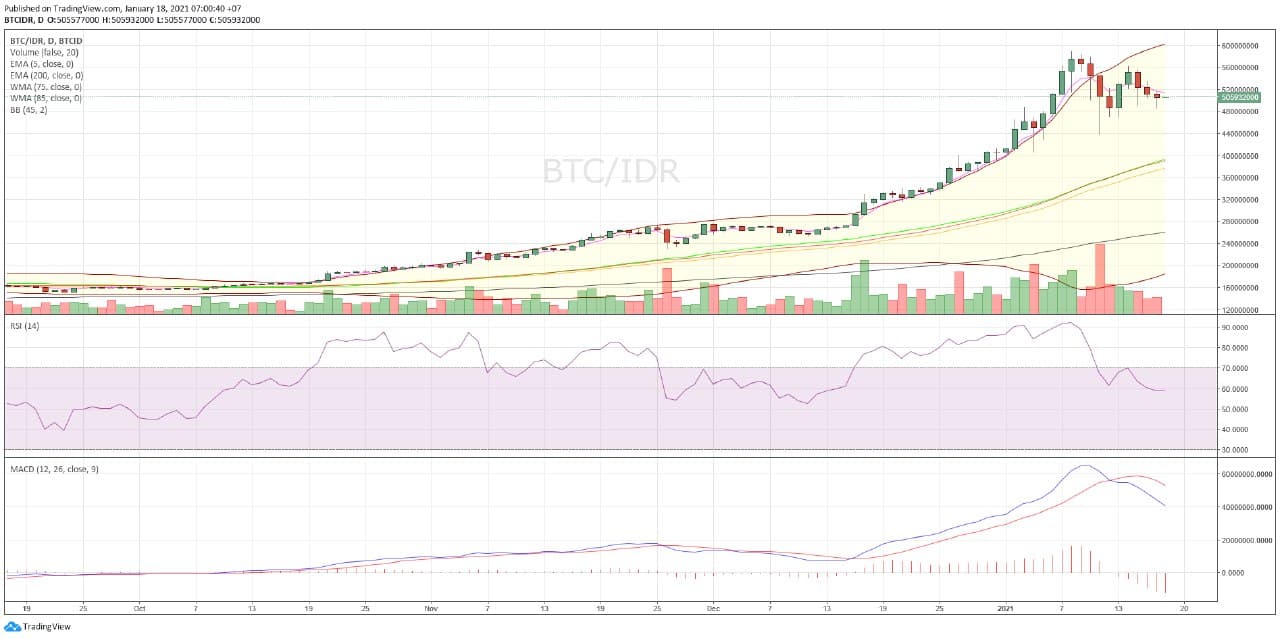
Chart Bitcoin/IDR
In today’s trading, BTC moved at the lowest level of IDR 485,000,000 and the highest level was IDR 518,000,000
Here’s BTC’s technical analysis this week:
| action | ||
| EMA 5 | 513,391,608 | buy |
| WMA 75 | 390,972,847 | buy |
| WMA 85 | 376,434,647 | buy |
| EMA 200 | 260,609,699 | buy |
| RSI (15) | 58.8832 | buy |
| MACD 12,26 | 40796096.41 | sell |
| Summary | BUY (5) SELL (1) | |
| bullish |
- Ethereum (ETH)
Ethereum is back in a bullish crypto asset. Last week, ETH had resistance or a decline in prices after passing its highest level. After crossing IDR 18 million, ETH returns to IDR 14 million.
However, only temporarily, Ethereum’s uptrend is increasing again. ETH is still at its highest level of IDR 17 million. Ethereum’s rise is still happening over the next week.
Ethereum is also a Bitcoin fork where the price movements between ETH and BTC will be similar.
However, ETH has an unlimited supply, unlike BTC. However, at the end of last year, ETH locked in 1.1% of its total supply thus affecting prices at the beginning of this year.
Locking these limits is part of the Ethereum 2.0 evolution.
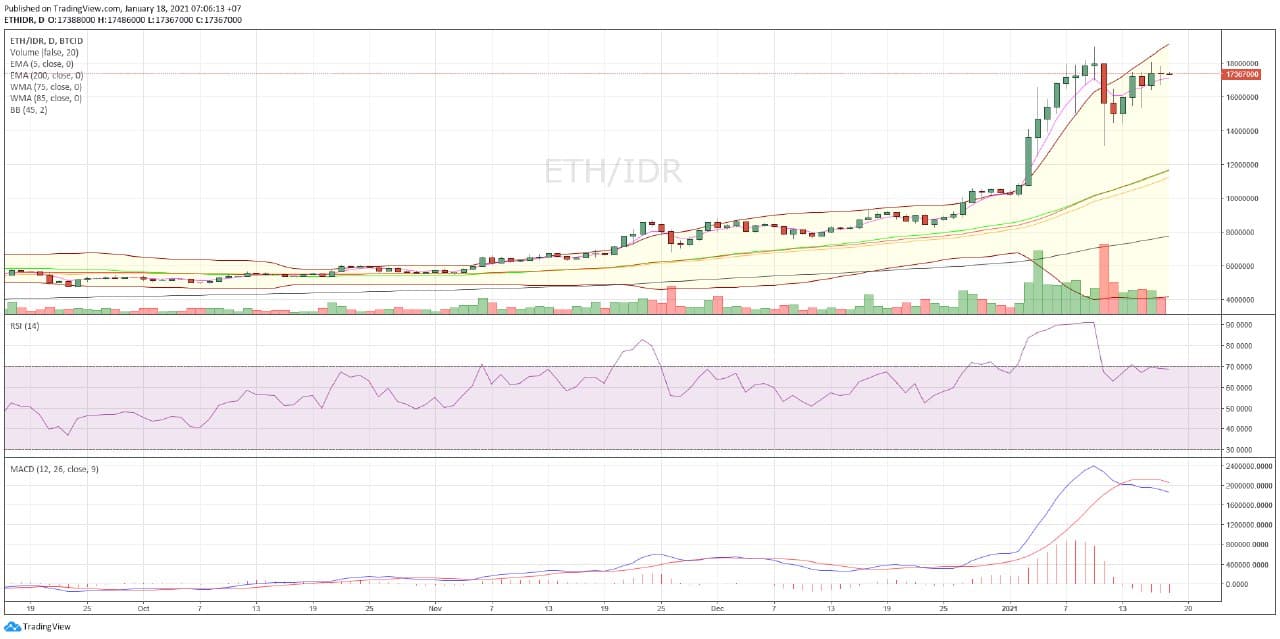
Chart ETH/IDR
In today’s trading, ETH moved at the lowest level of IDR16,717,000 and the highest level was IDR17,850,000. ETH entered into 5 bullish crypto assets this week.
Here’s the ETH technical analysis for this week:
| action | ||
| EMA 5 | 17,149,584 | buy |
| WMA 75 | 11,700,223 | buy |
| WMA 85 | 11,240,562 | buy |
| EMA 200 | 7,768,040 | buy |
| RSI (15) | 68.9844 | buy |
| MACD 12,26 | 1870053.503 | sell |
| Summary | BUY (5) SELL (1) | |
| bullish |
- Cardano (ADA)
Cardano (ADA) is predicted to increase this week. Cardano is like Etheruem which provides smart contracts for decentralized application development.
ADA’s innovations and price movements attracted investors’ attention so that price increases were also seen this week.
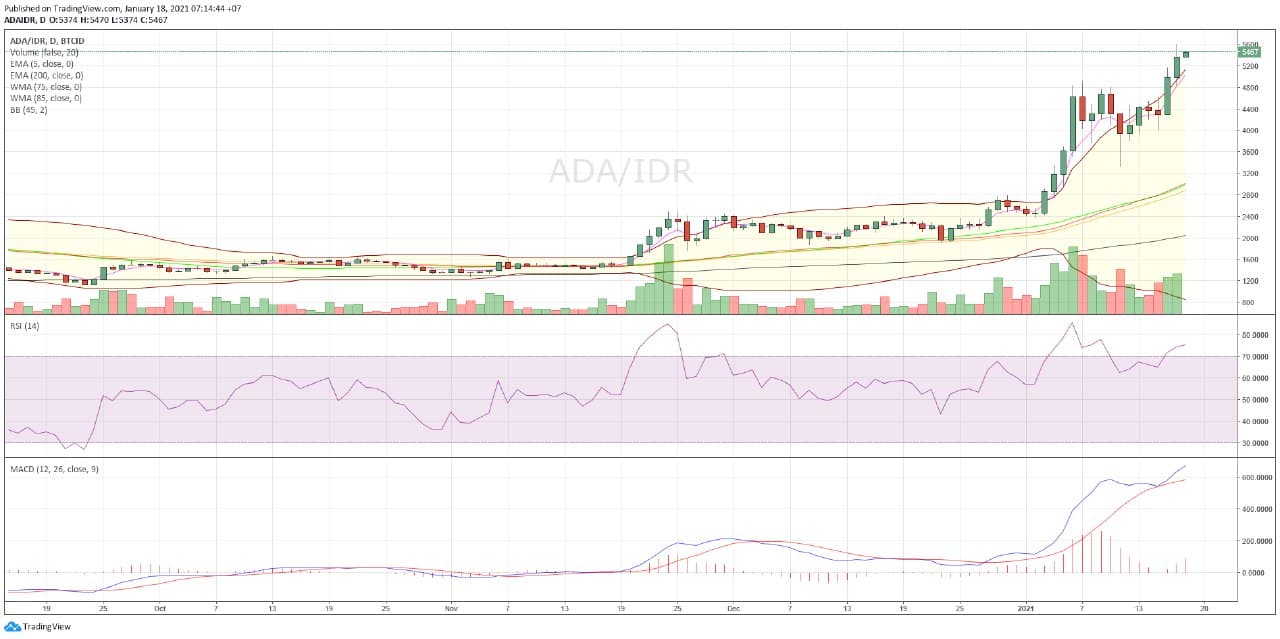
Chart ADA/IDR
In today’s trading, ADA moved at the lowest level at Rp4840 and the highest level at Rp5,600. ADA has entered into 5 bullish crypto assets this week.
Here’s the ADA technical analysis for this week:
| action | ||
| EMA 5 | 5,024 | buy |
| WMA 75 | 3,015 | buy |
| WMA 85 | 2,889 | buy |
| EMA 200 | 2,047 | buy |
| RSI (15) | 75.087 | buy |
| MACD 12,26 | 676.1898 | buy |
| Summary | buy | |
| bullish |
- WAVES
The next bullish crypto asset is WAVES. This crypto asset is a decentralized finance platform under the ERC20 network.
This crypto asset was in a bullish trend before the end of last week. The increase in crypto asset prices was due to the developing innovation of the DeFi WAVES platform.
Even though the bullish trend has started, over the next week, WAVES prices are predicted to continue to rise.
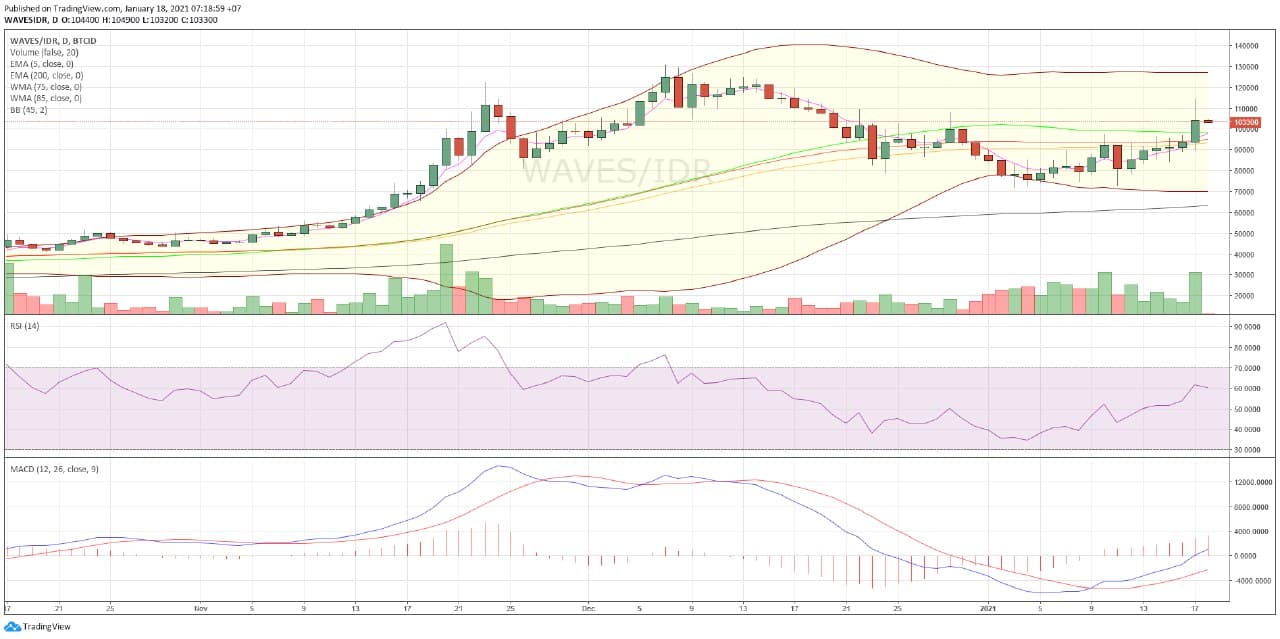
Chart WAVES/IDR
In today’s trading, WAVES moved at the lowest level at IDR89,400 and the highest level at IDR114,800. WAVES entered into 5 bullish crypto assets this week.
Here’s LTC’s technical analysis for this week.
| action | ||
| EMA 5 | 97,959 | buy |
| WMA 75 | 94,817 | buy |
| WMA 85 | 93,215 | buy |
| EMA 200 | 63,386 | buy |
| RSI (15) | 60.49 | buy |
| MACD 12,26 | -5797.0377 | buy |
| Summary | BUY | |
| bullish |
- Uniswap (UNI)
Another bullish crypto asset is Uniswap (UNI). This crypto asset is a decentralized platform and smart contract that is under the ERC-20 network.
Technological innovation has led UNI to experience an increase in prices that started last week. This week, the UNI price is predicted to increase slightly.

Chart UNI/IDR
In today’s trade, UNI moved at the lowest level of IDR 115,002 and the highest level of IDR 130,000. UNI has entered into 5 bullish crypto assets this week.
The following is the UNI technical analysis for this week:
| action | ||
| EMA 5 | 109,325 | buy |
| WMA 75 | 66,497 | buy |
| WMA 85 | 64,345 | buy |
| EMA 100 | 60,726 | buy |
| RSI (15) | 79.6642 | overbought |
| MACD 12,26 | 13940.0097 | buy |
| Summary | BUY (5) OVERBOUGHT (1) | |
| bullish |
5 Crypto Assets will Bullish on This Week
- Tether (USDT)
Tether (USDT) is a stablecoin that adopts 1: 1 at a price of US dollars (USD). This week the USD price is rumored to be reaching its lowest level for the last several months.
The decline in US dollar prices occurred due to the weakening price of the United States economy after the Presidential Election. Until the time of President Joe Biden, the United States economy has not shown certainty.
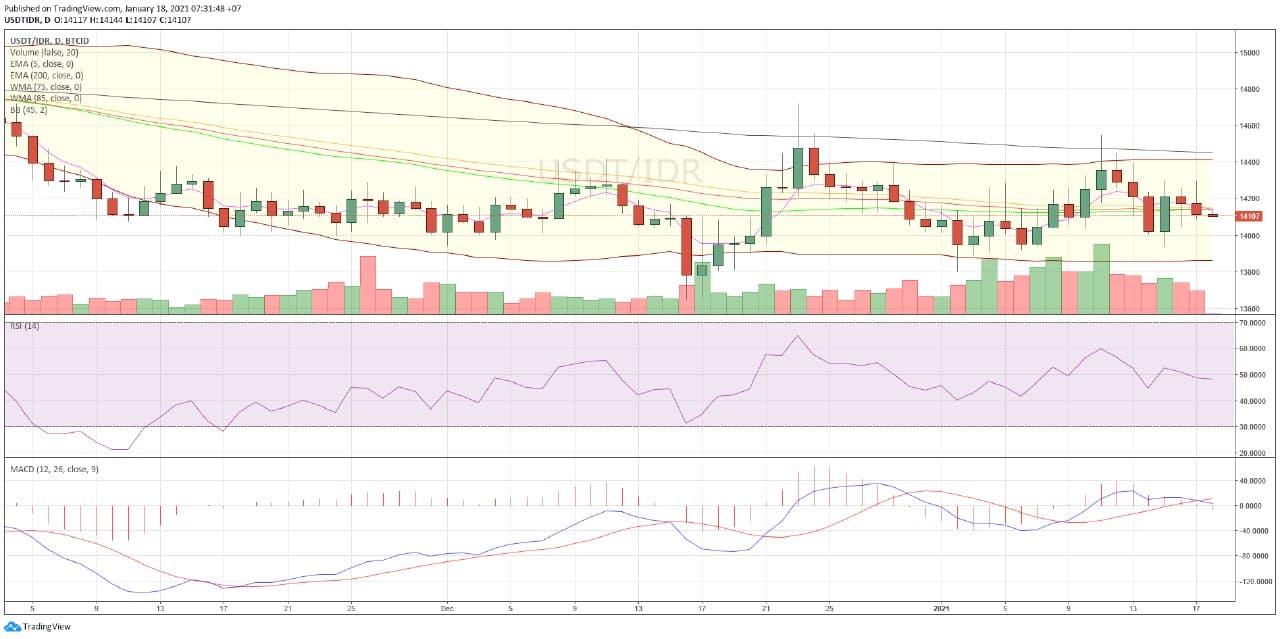
Chart USDT/IDR
In today’s trading, USDT moved at the lowest level of IDR14,092 and the highest level was IDR14,298.
| action | ||
| EMA 5 | 14,140 | sell |
| WMA 75 | 14,139 | sell |
| WMA 85 | 14,148 | sell |
| EMA 200 | 14,450 | sell |
| RSI (15) | 45.8222 | neutral |
| MACD 12,26 | -2.2764 | sell |
| Summary | SELL(5) NEUTRAL(1) | |
| bearish |
- Ripple (XRP)
Ripple (XRP) is still experiencing price weakness this week. This weakness continued from the previous weeks.
Ripple Labs was sued by the Security Exchanges Commission (SEC) or known as the Exchange and Equity Authority for alleged violations.
This has resulted in many brokers or exchanges in the United States that no longer sell XRP. Even so, the decline in XRP prices is predicted to be not too deep this week.
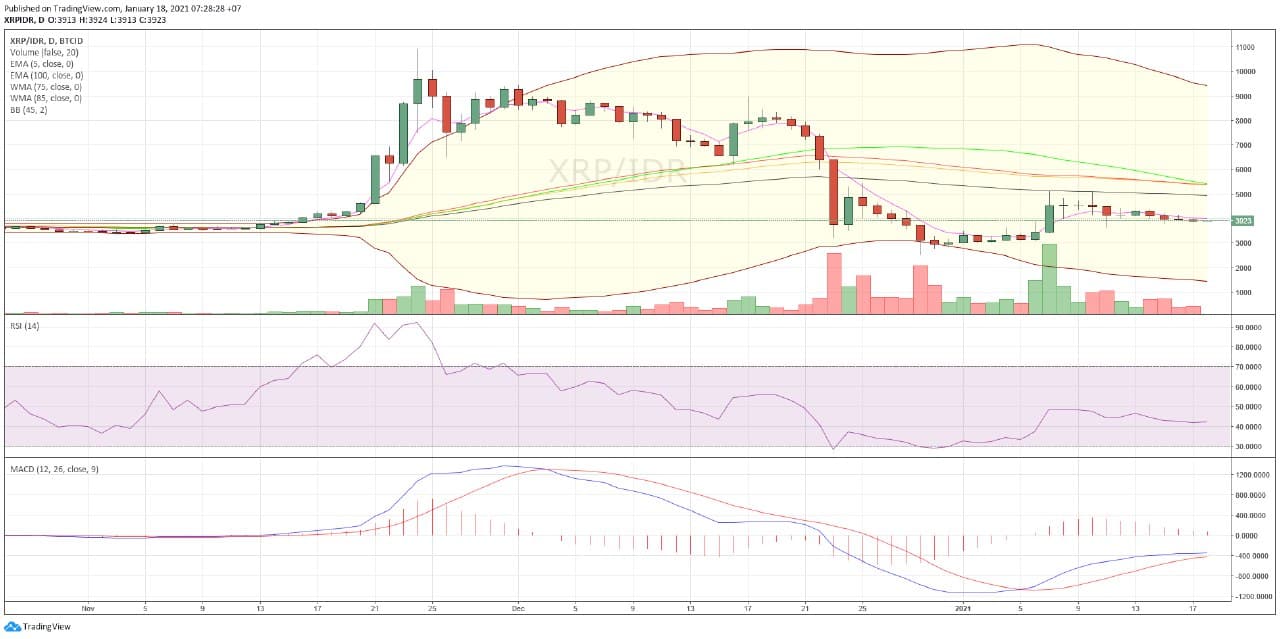
Chart XRP/IDR
In mid-year trading, XRP moved at the lowest level of IDR3 / 852 and the highest level of IDR4,032.
Here’s the XRP technical analysis for this week:
| action | ||
| EMA 5 | 4,351 | sell |
| WMA 75 | 6,058 | sell |
| WMA 85 | 5,820 | sell |
| EMA 200 | 4,497 | sell |
| RSI (15) | 48.2532 | neutral |
| MACD 12,26 | 492.0293 | oversold |
| Summary | SELL (4) NEUTRAL (1) OVERSOLD (1) | |
| bearish |
- DAD
DAD is a crypto asset that is experiencing a downward trend, the same as last year. Companies engaged in advertising services have experienced a decline in prices. One of the reasons is because it has not made an interesting innovation for investors.
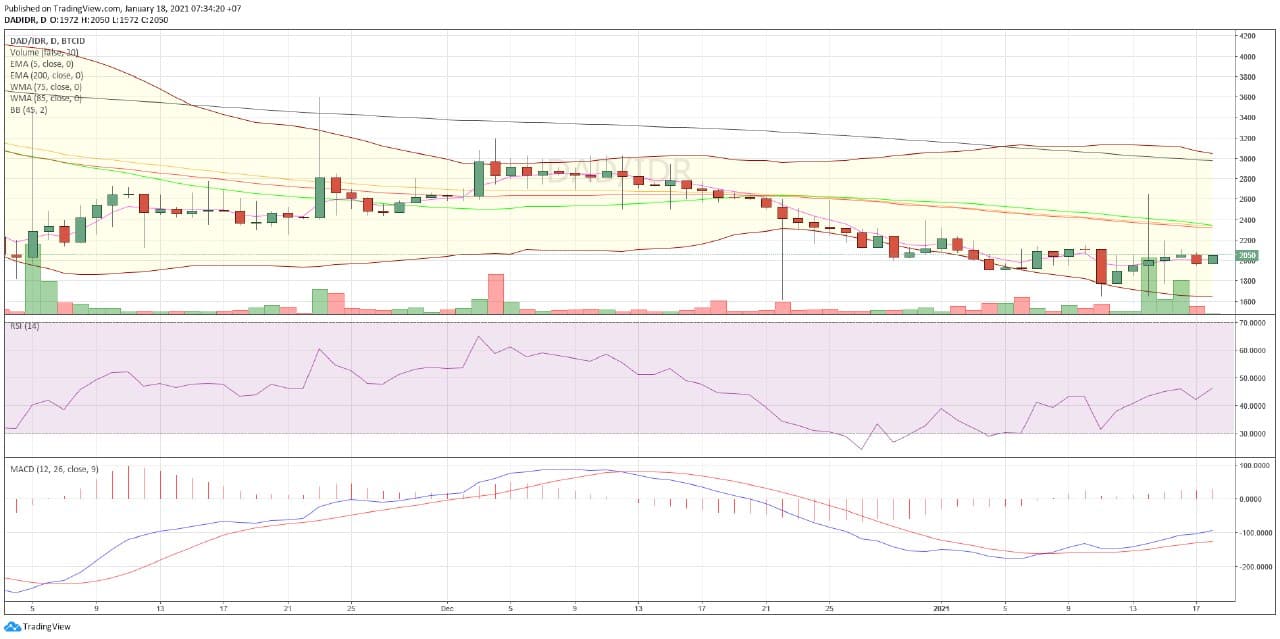
Chart DAD/IDR
In today’s trading, DAD moved at the lowest level of IDR1,956 and the highest level was IDR2,052
The following is DAD’s technical analysis for this week:
| action | ||
| EMA 5 | 2,055 | sell |
| WMA 75 | 2,423 | sell |
| WMA 85 | 2,435 | sell |
| EMA 200 | 3,071 | sell |
| RSI (15) | 43.1045 | neutral |
| MACD 12,26 | -1432000 | oversold |
| Summary | SELL (4) NEUTRAL(1) OVERSOLD(1) | |
| bearish |
- OKB
OKB is a crypto asset that has experienced a decline in prices this week. OKB is a less popular crypto asset. Its rating on the coinmarketcap.com website is only 318.
Again, an unattractive innovation that makes this crypto asset abandoned by its investors and switch to other crypto assets. This is a possible cause for OKB to fall in price.

Chart OKB/IDR
In today’s trading, OKB’s lowest price was at the level of Rp84,500 and the highest price was Rp89,800.
Here’s OKB’s technical analysis for this week:
| action | ||
| EMA 5 | 88,283.00 | sell |
| WMA 75 | 91,275.00 | sell |
| WMA 85 | 92,294.00 | sell |
| EMA 200 | 93,373.00 | sell |
| RSI (15) | 52.8384 | buy |
| MACD 12,26 | -730.8522 | buy |
| Summary | SELL (4) buy (2) | |
| bearish |
- USD Coin (USDC)
USD Coin or USDC, is the same as Tether (USDT) which is a stablecoin derived from the US dollar (USD). The price decline also occurred due to the weakening dollar price due to the weakening US economy.
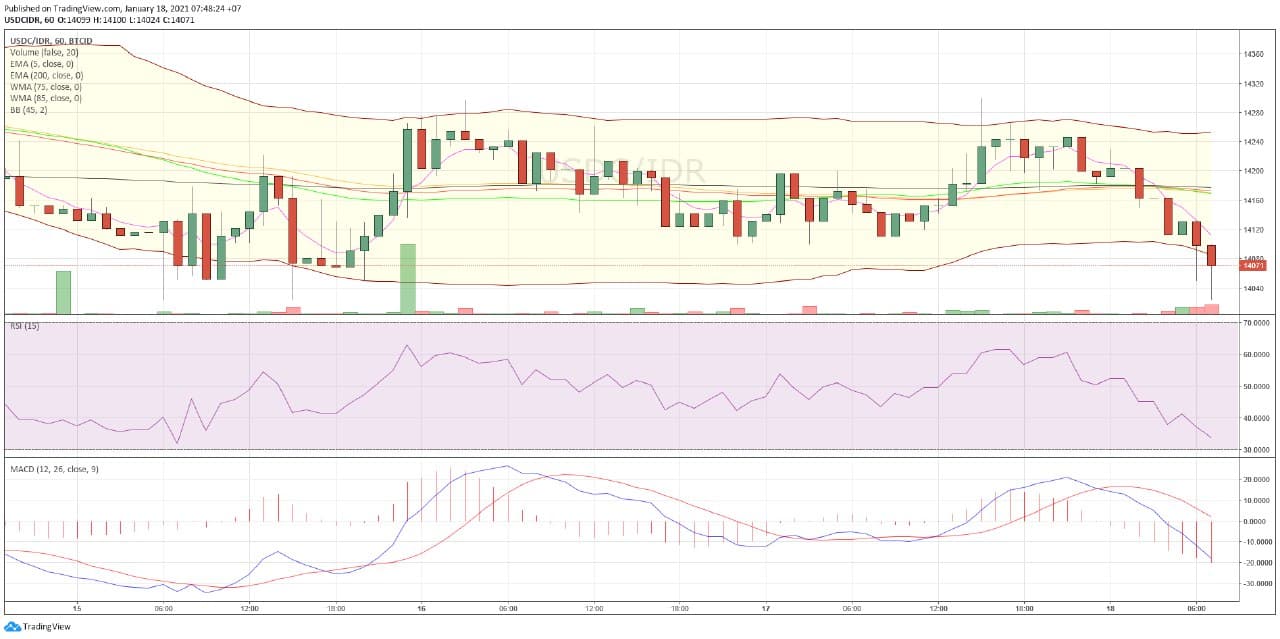
Chart USDC/IDR
In today’s trading, USDC moved at the lowest level of IDR14,024 and the highest level was IDR14,300.
Here’s the USDC technical analysis for this week:
| action | ||
| EMA 5 | 14,150 | sell |
| WMA 75 | 14,176 | sell |
| WMA 85 | 17,173 | sell |
| EMA 200 | 14,178 | sell |
| RSI (15) | 41.4227 | sell |
| MACD 12,26 | -5.8216 | sell |
| Summary | SELL | |
| bearish |
NOTE: If the EMA 5 crosses the WMA 75, 85 and 200 EMA and these lines intersect from bottom to top, the market trend tends to go up (bullish),
In each table above, it shows that if the value of EMA 5 is higher than WMA 75.85 and EMA 200 then the market tends to rise (bullish).
If the RSI and MACD values ??show the same condition, it means that the market is showing the same trend, overbought conditions or oversold conditions are an indicator that the market is at a point of changing the trend direction.
ATTENTION: All content which includes text, analysis, predictions, images in the form of graphics and charts, as well as news contained on this website, is only used as trading information only, and does not constitute a suggestion or suggestion to take an action in a transaction whether to buy or sell certain crypto assets. All crypto asset trading decisions are independent decisions by the user. Therefore, all risks arising from it, whether it is profit or loss, are not the responsibility of Indodax.


