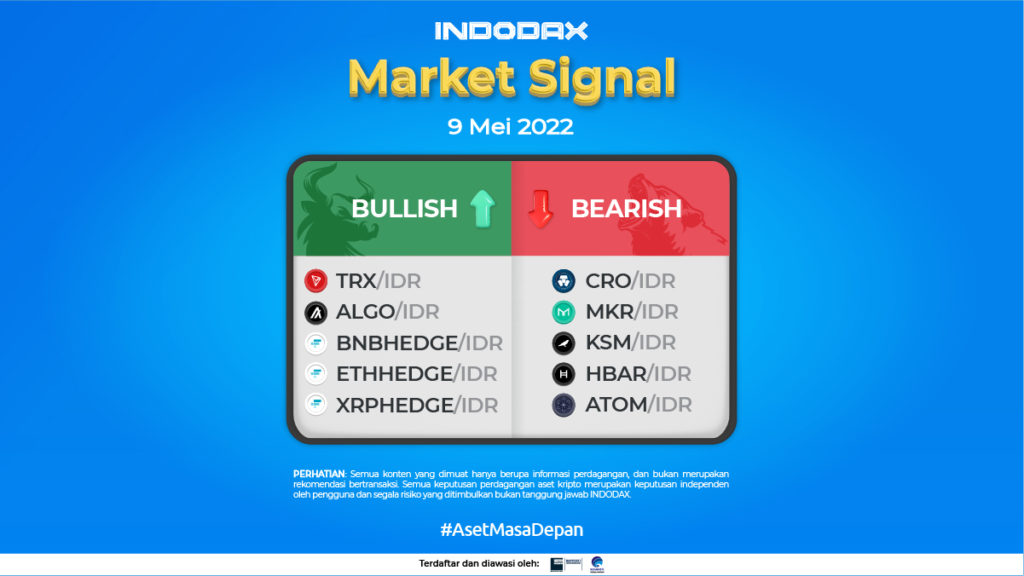
This week, Tron (TRX) is at the top of the Bullish trend. Let’s find out more as a reference in determining which crypto assets you can buy or sell!
5 Bullish Crypto Assets
-
Throne (TRX)
The increase in the price of Tron (TRX) occurred from May 4, 2022, the Tron (TRX) price moved from the level of 1032 and then rose to 1247. It hit the price of 1278, but the RSI had entered the overbought area, so the Tron (TRX) price was unable to rise higher and instead corrected to 1090.
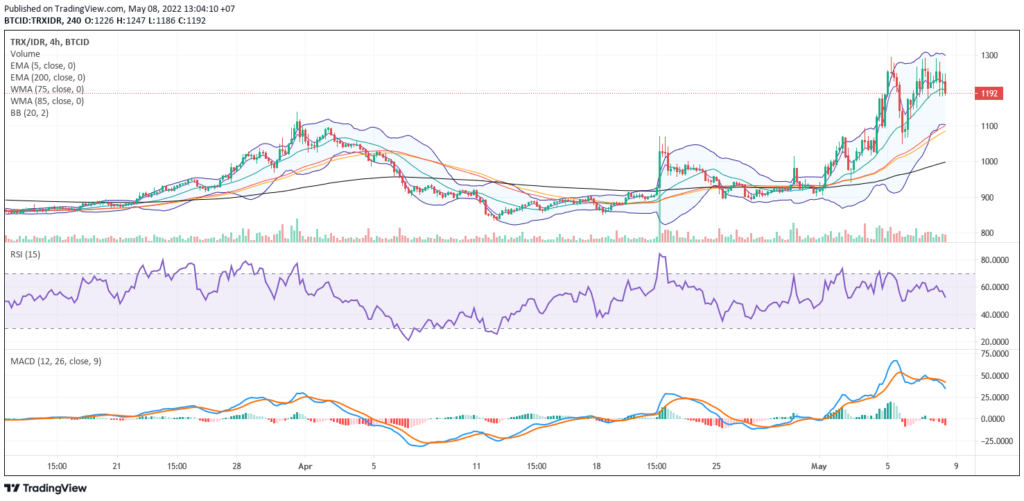
In the 4-hour chart, the price is still above the EMA / 200 (997) indicating that the price is still in the uptrend channel, buying can still dominate the price. The support level is at the price of 1083 – 1140. Resistance levels are at 1265 – 1294. Corrections and candles will reverse if the price is corrected to the level of 1100 and below the price of 1000.
The trend can be broken, if the price returns to a sideways pattern in the resistance area of 1210 – 1250 and can break the upper limit of 1300.
-
Algorand (ALGO)
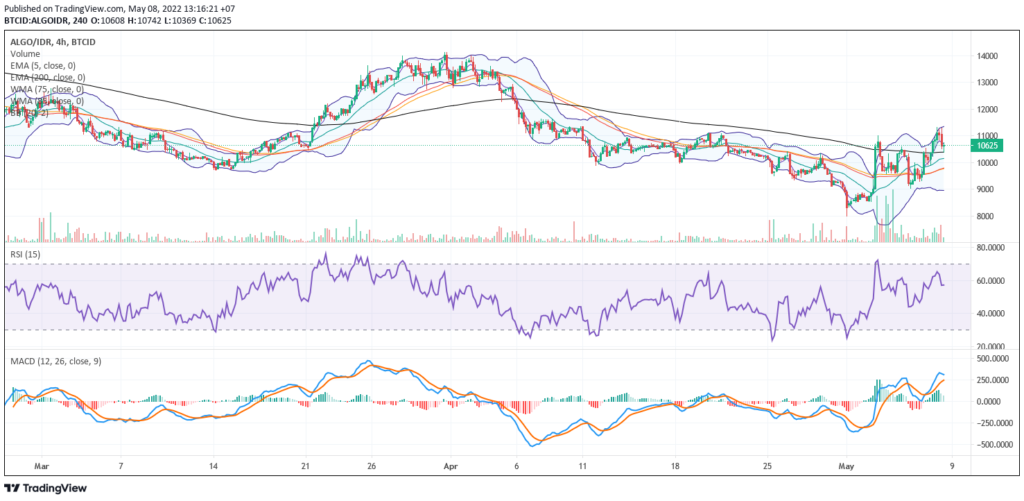
The MACD indicator shows that the trend is still positive with a positive histogram. The price will fail to enter a long-term bullish phase if the candle is corrected below 10385 and drops back to a level below WMA/85 (9765).
-
1x Short BNB Token (BNBHEDGE)
The increase of 1X Short BNB Token (BNBHEDGE) is inseparable from the decline that occurred in BNB. The 4-hour chart shows the price starting to rise from the level of 101.252 on May 5, 2022, then moving up to the range of 106,668. It had moved sideways between 106k – 108k. then the uptrend continued to the level of 113k on May 8, 2022.
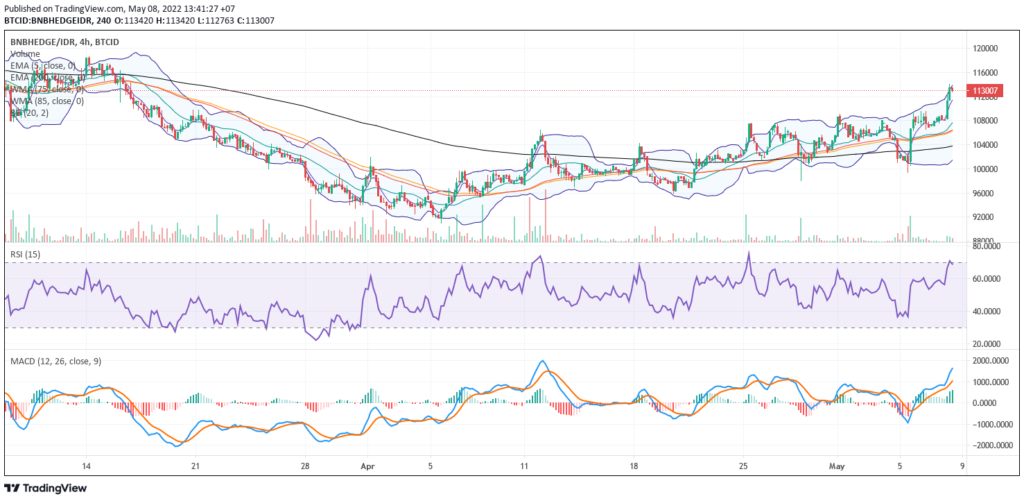
The RSI indicator shows the line has entered the overbought area, MACD shows a positive trend with a positive histogram. A correction may occur at the level of 109k before the price rises higher. This assumption will be invalid if BNB can dominate purchases and can increase purchase demand even higher.
-
1x Short ETH Token (ETHHEDGE)
The rise of 1X Short ETH Token (ETHHEDGE) is inseparable from the decline that occurred in ETH. The 4-hour chart showed the price started to rise from the level of 208k on May 5, 2022, then moved up to the range of 220k. It had moved sideways between 220k – 225k. then the uptrend continued to the level of 237k on May 8, 2022.
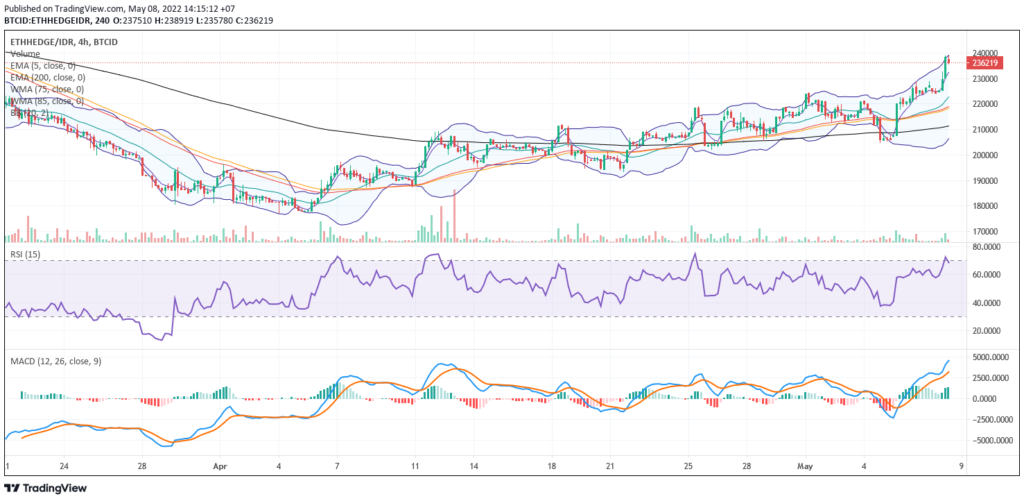
The RSI indicator shows that the line has entered the overbought area, MACD shows a positive trend with a positive histogram. A correction may occur at the level of 220k before the price rises higher. This assumption will be invalid if ETH coins can dominate purchases and the demands are higher.
-
1X Short XRP Token (XRPHEDGE)
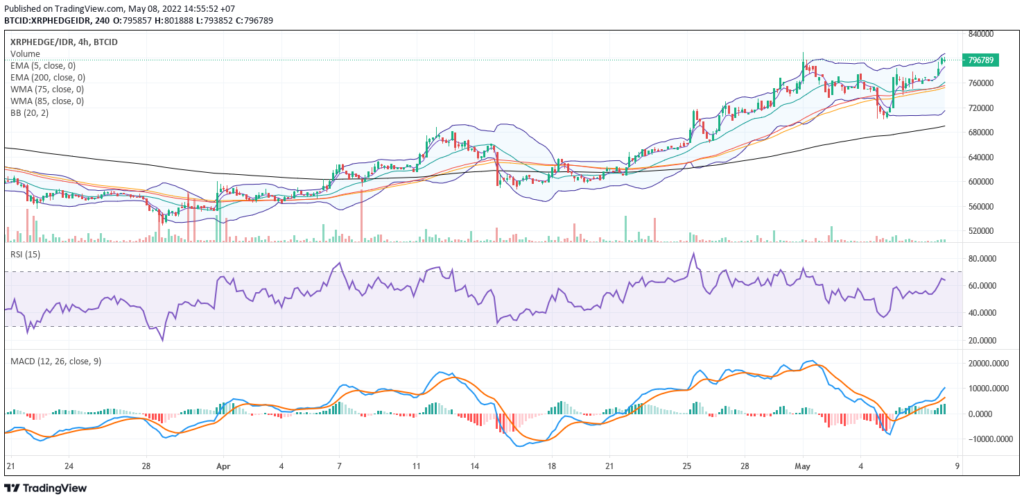
The rise of1X Short XRP Token (XRPHEDGE) is inseparable from the decline that occurred in XRP. The increase occurred on May 5, 2022 at 713k and rose to the level of 770k. then the price entered a sideways phase and moved between 747k – 770k . This assumption will be invalid if XRP can dominate purchases and can increase demand higher.
5 Bearish Crypto Assets
-
Crypto.com Chain (CRO)
The Bearish CRO phase was confirmed with the corrected price below WMA 85 (4577). The weakening continued from the level of 4677 to the level of 3900 which occurred on May 5, 2022. The correction can continue, and it has entered the oversold area if seen from RSI.
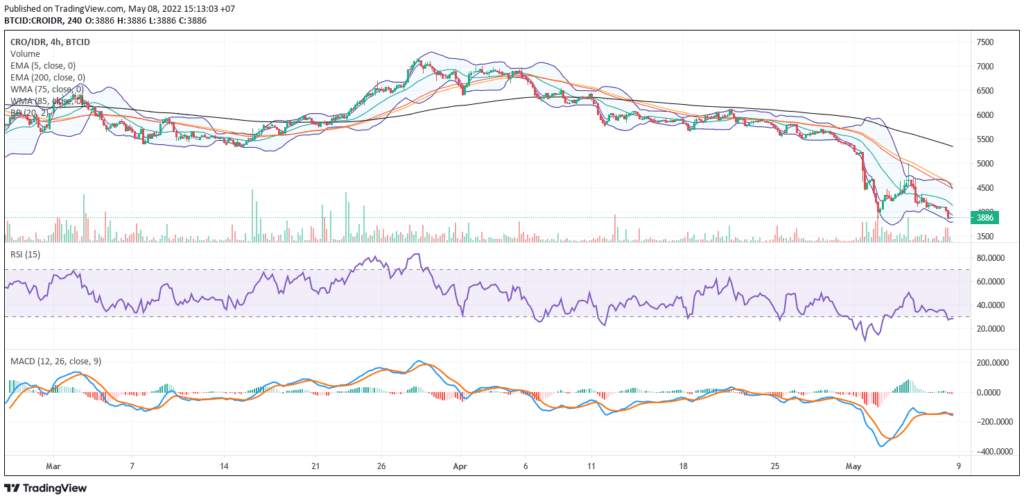
Further price support is in the range of 3000 – 2500, and contrary to this assumption, the price will still experience a temporary spike to the level of 4500. Purchases will again dominate if the price can rise higher than 4500 – 5000.
-
Maker (MKR)
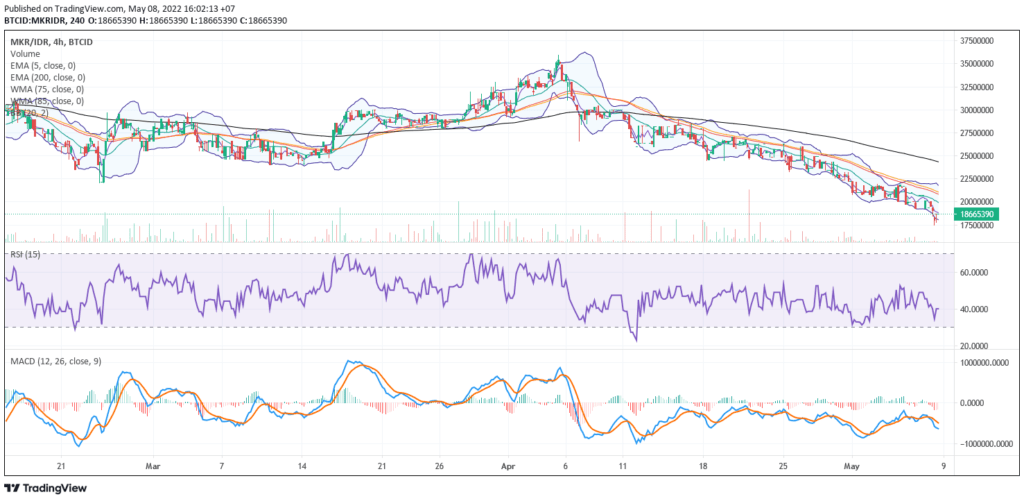
The price of MKR continues to decline, from the beginning of May, the price fell from 22,819,843 to 18,148,032 on May 8, 2022. The decline also occurred due to the price of BTC and the dominance of other altcoins also weakened, support levels were at the price of 18.1 million – 19 million. Increases can occur if the price can break the resistance of 20 million – 21 million.
-
Kusama (KSM)
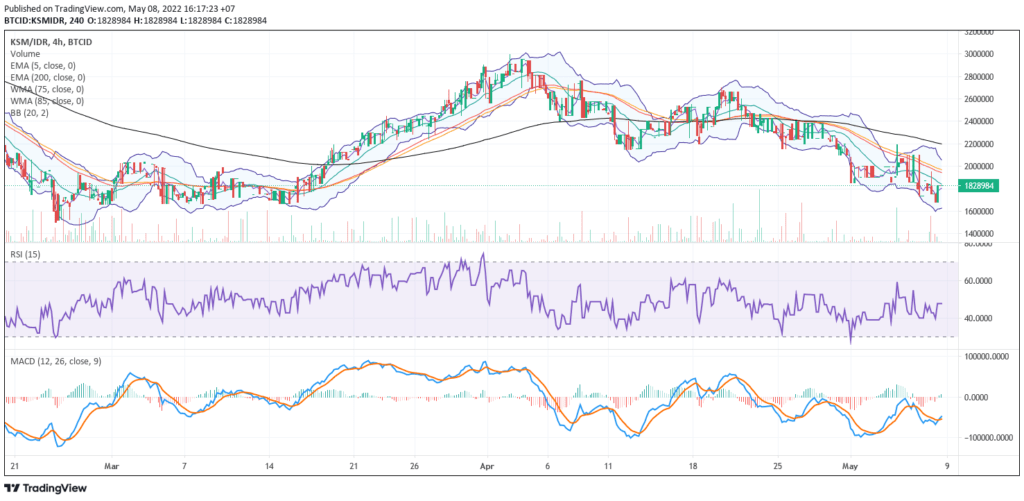
The KSM candle on the 4-hour chart, forming a bearish sideways pattern, following the downward trend of other altcoins, the price corrected to 1,673,846 from the beginning of May at 1,928,386. The price had bounced several times to the levels of 2 million and 2.1 million. But the price did not last long and was instead corrected again and at the time this article was written, the price was at the level of 1.8 million. MACD indicator shows this narrowing is fairly reasonable because KSM/IDR has experienced a fairly deep correction.
-
Hedera Hashgraph (HBAR)
On the 4-hour chart, the price of HBAR / IDR has decreased quite deeply, the price decreased from April 25, 2022. From the price of 2741, the price dropped to the level of 1900 on May 8, 2022. It had experienced a price increase to 2226 on May 5, 2022, the price could not rise higher, and selling still dominated the price.
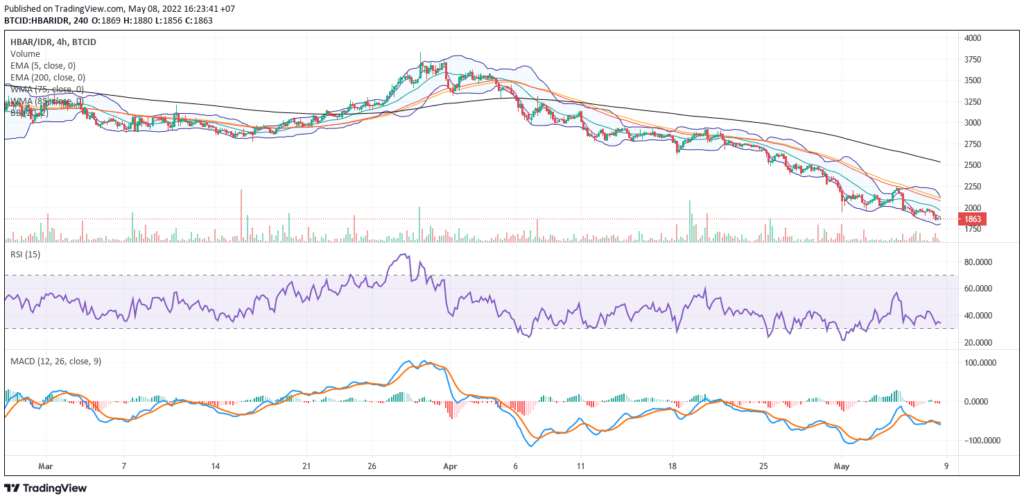
The correction can continue to the level of 1750. Contrary to the scheme, the price may rise higher if it can break WMA /85 (2110).
-
Cosmos (ATOM)
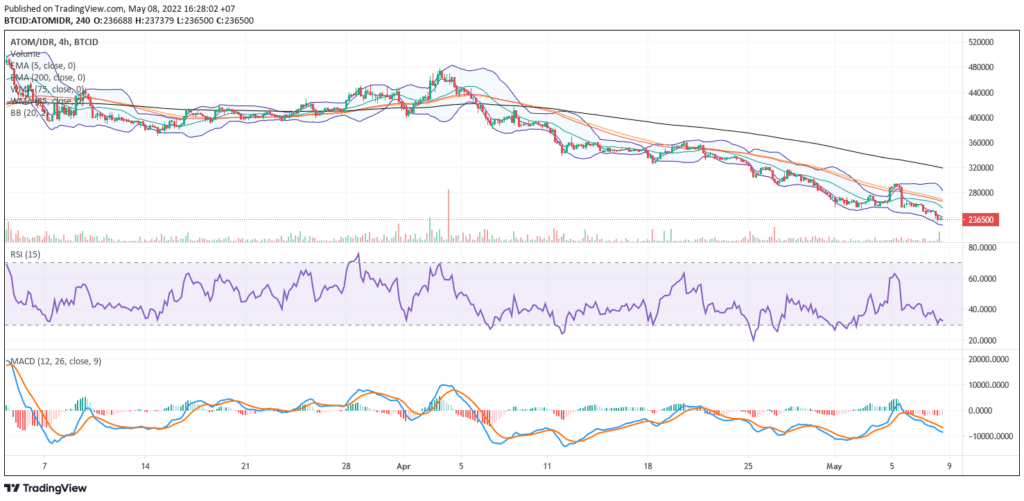
The ATOM candle on the 4-hour chart is also bearish, briefly rose to the level of 290000 on May 5, 2022, but the price was unable to rise higher and corrected again at the level of 236500. This weakening is also in line with the MACD indicator, which shows that there is a negative trend on ATOM, which will be further confirmed by the RSI indicator. RSI is still waiting n see entering the oversold area.
Also read: Learn Crypto Technical Analysis: Definition to Steps
NOTE: If the EMA is 5, past the WMA lines 75, 85, and EMA 200 and the line intersects from bottom to top, then the market trend tends to rise (bullish), in each table above shows if, the value of EMA 5 is higher than WMA 75.85 and EMA 200 then the market tends to rise (bullish).
If the RSI and MACD values show one condition in common, it means that the market is showing the same trend, overbought conditions, or oversold, which is one indicator that the market is already at the reversal trend.
CAUTION: All content that includes text, analysis, predictions, images in the form of graphics or charts, as well as news published on this website, is only used as trading information, and does not constitute an advisory or suggestion to take action in transacting either buying or selling certain crypto assets. All crypto asset trading decisions are independent decisions by users. Therefore, all risks arising from it, both profit and loss, are not the responsibility of Indodax.


